

Ninety days before a renewal, I sat in on a call with a customer who used our product daily. Usage was healthy. Adoption dashboards showed green. By every metric we tracked, this was a happy customer.
Then their procurement lead asked a simple question. What measurable business outcomes did you get from this investment?
The room went quiet. The customer started listing features they used. The procurement lead wanted numbers. Business metrics. Something finance could point to. We could not give them that. The renewal was at risk despite strong usage.
That conversation changed how I think about product measurement entirely.
The gap nobody talks about
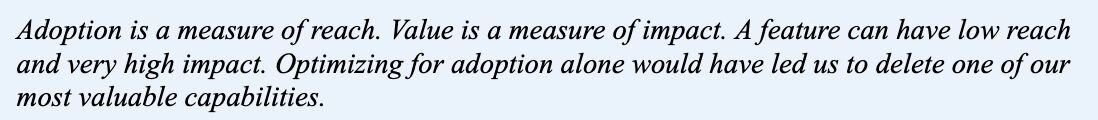
Product teams are good at measuring what gets used. They are not good at measuring what gets improved.
Usage tells you a feature was opened. It does not tell you whether the person who opened it achieved anything meaningful. Those are two completely different questions and most product teams only ask the first one.
Research from Pendo found that 80% of features are rarely or never used. But the more uncomfortable finding is that high usage does not guarantee high value. In our own platform we had a capability with 60% adoption. By any standard measure that looked like success.
Then we asked a different question. Of the customers actively using this feature, how many can point to a specific business outcome it enabled?
Around 15% could answer that clearly. The remaining 85% used it because it was there, not because it was solving a problem they cared about.
That number reframed everything.
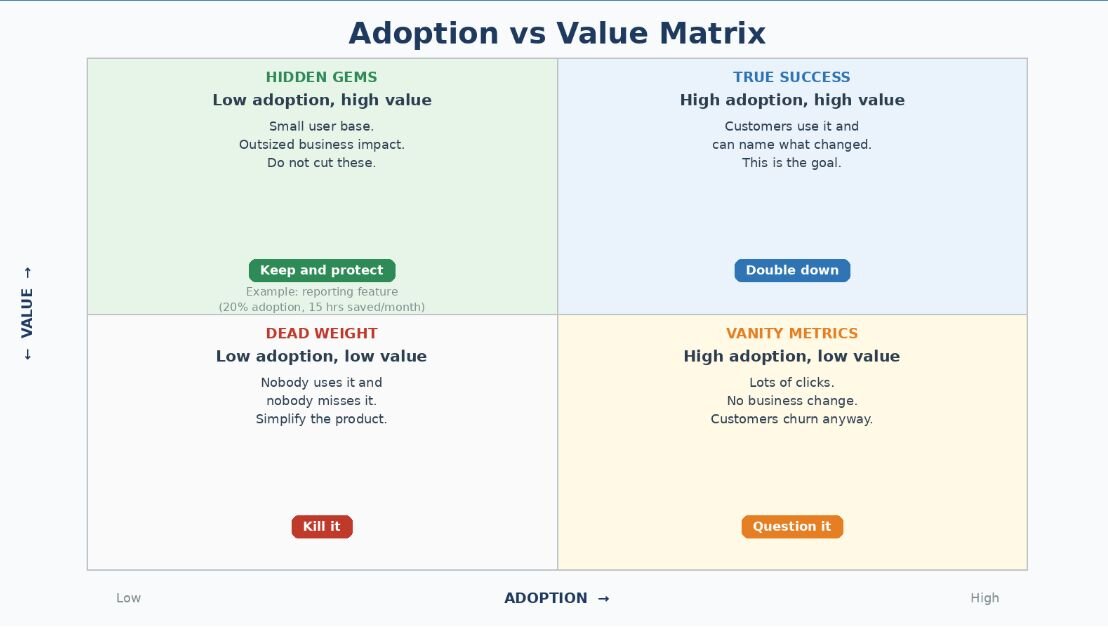
Figure 1: Adoption vs value matrix - not all high-adoption features are valuable, not all low-adoption features should be cut
What I changed in our product process
After that renewal call, I introduced one rule for every new feature we scoped. Before writing a single requirement, the team had to answer three questions.
- What specific business metric should improve for the customer as a result of this feature?
- How will we know if that metric actually moved?
- What does good look like six months after launch?
This sounds straightforward. It is not. The first time we ran this exercise the team struggled for two hours on a feature we were all excited about. We could describe what the feature did clearly. We could not describe what it would change for the customer.
That struggle was valuable. It told us the feature was solving our internal prioritization problem, not a customer outcome problem. We deprioritized it.
The framework we use now: The outcome clarity test
After running this process across dozens of features, I developed a simple framework we now use at the start of every product cycle. I call it the Outcome Clarity Test, and it has three layers.
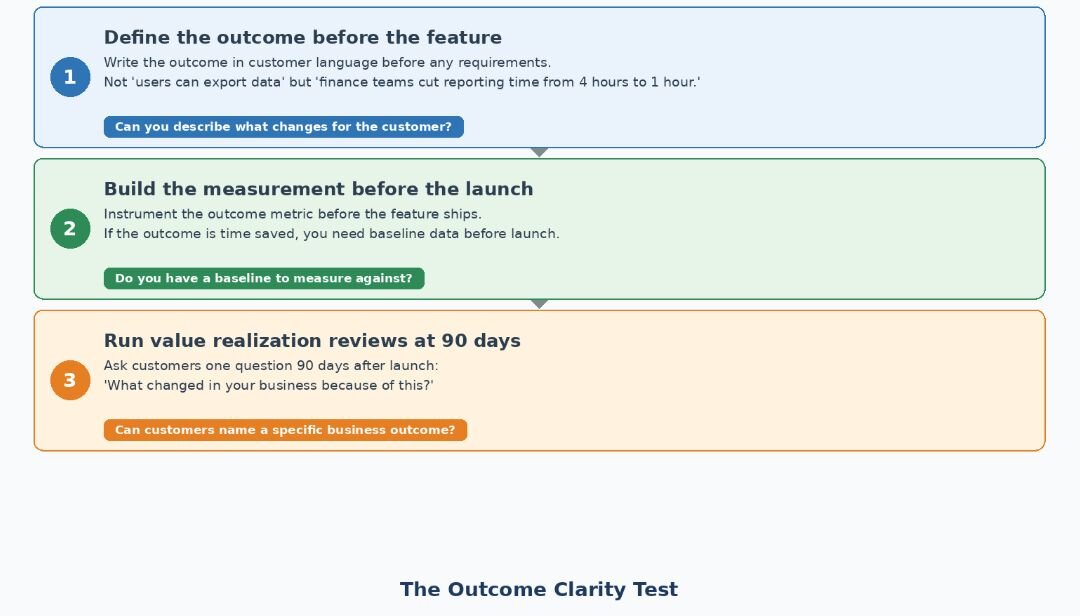
Layer one asks you to define the outcome before the feature. Write the outcome in customer language before writing any requirements. Not “users can export data” but “finance teams reduce time spent on monthly reporting from four hours to under one hour.” If you cannot write the outcome in customer language you do not understand the problem well enough to build a solution.
Layer two requires you to build the measurement before the launch. Instrument the outcome metric before the feature ships. If the outcome is time saved, you need baseline time data before launch. If the outcome is error reduction, you need baseline error rates. Most teams skip this step and then cannot prove impact after the fact.
Layer three is the value realization review at ninety days. Sit with customers not to demo new features but to ask one question. What changed in your business because of this? Customers who can answer that question clearly are your strongest renewal and expansion candidates. Customers who cannot are at risk regardless of their usage patterns.
The reporting feature we almost killed
The most useful application of this framework came from a feature we were planning to deprecate.
We had a reporting capability used by around 20% of customers. Low adoption by any standard measure. The product team had flagged it for removal as part of a simplification initiative.
Before removing it we ran our value realization review with the customers using it. What we found stopped the deprecation immediately.
That 20% of customers was saving an average of fifteen hours per month on manual report generation. For them it was not a nice-to-have. It was a core workflow. Removing it would have directly damaged their business operations.
The feature had low adoption because it was highly specialized. It was not relevant to most customers. But for the customers it was relevant to, it was critical. This is exactly the Hidden Gems quadrant from Figure 1 in action.
That insight changed more than the roadmap decision. We kept the feature, sharpened its positioning around high-value reporting workflows, and made sure customer-facing teams knew how to identify the customers who would benefit most.
What this changes about customer conversations
The shift from measuring adoption to measuring value changes how you talk to customers.
A feature-led conversation sounds like this: you should try this feature, a lot of customers are using it, here is a tutorial. It positions you as a vendor pushing adoption. The customer nods politely and does not change their behavior.
An outcome-led conversation sounds completely different: what are you trying to achieve this quarter, which of your current workflows takes the most time or creates the most errors, let me show you what similar customers have done to address that. It positions you as a partner helping them achieve something specific. Customers engage differently because the conversation is about their goals, not your product.
Our customer success team made this shift after we introduced value realization reviews. Instead of reviewing feature adoption in renewal calls they started reviewing business metric changes. Customers who could point to concrete improvements renewed at substantially higher rates than customers who could only discuss usage patterns. It also gave the team a clearer signal on which workflows deserved more investment and which ones were simply generating activity without real customer impact.
What to do this week
Pick one feature your team shipped in the last six months that you consider a success based on adoption numbers.
Now ask the customers using it one question. What specifically changed in your business because of this feature? Not how often they use it. What changed.
If they can answer that clearly you have a genuinely successful feature. If they describe what the feature does rather than what it changed, you have a usage metric masquerading as a success metric.
Do that exercise for your top five features. The pattern you find will tell you more about your product strategy than your entire analytics dashboard.
The metric that actually predicts renewal
After running value realization reviews for several renewal cycles a clear pattern emerged.
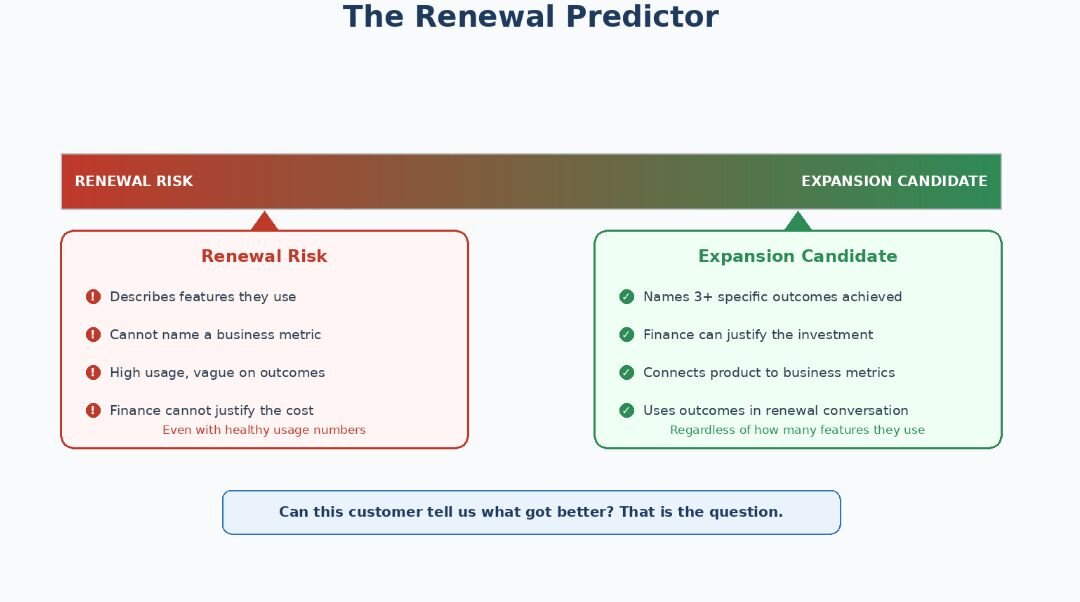
Customers who could articulate three or more specific business outcomes improved by our product renewed at very high rates regardless of how many features they used. Customers who described their usage enthusiastically but struggled to name specific business improvements were renewal risks regardless of their activity levels.
That finding changed our entire approach to customer health scoring. We moved away from usage frequency as the primary health indicator and toward outcome clarity. Can this customer tell us what got better? That became our most reliable predictor of whether they would stay.
The shift worth making
Product management has long been measured by what ships. The next evolution is being measured by what changes for customers after it ships.
That requires different questions at the start of a product cycle. Different instrumentation during development. Different conversations with customers after launch.
It is harder than counting features released. But it is the only measurement that honestly answers whether the work mattered.
Customers do not buy features. They buy changes to their business. The teams that close the gap between what they ship and what actually changes will be the ones that build products people cannot imagine working without.
What outcome metrics do you track beyond adoption?
References
[1] Pendo (2024). 2024 Software Benchmarks. https://www.pendo.io/pendo-blog/product-benchmarks/
[2] Pendo (2019). The 2019 Feature Adoption Report. https://www.pendo.io/resources/the-2019-feature-adoption-report/
[3] ProductPlan (2024). State of Product Management Report. https://www.productplan.com/2024-state-of-product-management-annual-report/
[4] ProductPlan (2025). State of Product Management Report. https://www.productplan.com/2025-state-of-product-management-annual-report/
[5] Gainsight (2024). Customer Success Index. https://www.gainsight.com/resource/the-customer-success-index-2024/