

As a product leader, I often felt my role was akin to the captain of a ship – responsible for keeping the big picture in mind, preemptively identifying and navigating risks along the way, and maximizing business value with limited resources.
One of the most critical product leadership skills that demonstrate these traits is the ability to craft strategic product roadmaps, which sets the direction for the business and engineering teams. When I owned a portfolio of 20+ B2B cloud-native products, roadmapping was one of the most challenging (and rewarding) parts of the role, because every product seemed strategic, but given the time dependencies and resource availability, I had to prioritize and pick an ordered set of key product investments for the year.
My mind swarmed with questions during my first product roadmapping experience: Should I prioritize the high ROI or ‘big-idea’ products? Am I prioritizing the right combination of product features that matter to customers, while furthering the growth objectives of the business? What products should I explicitly deprioritize in order to keep the engineering team focused? Am I investing enough to improve technical debt, scalability, and performance – or focusing too much on shiny features? Based on product adoption metrics from the past year and shifts in the tech landscape, which products should I double-down on vs. pivot? Are there other internal teams building similar products that would impact my roadmap? How do I tell a compelling story around this roadmap to my leadership and go-to-market enablement teams?
To answer these questions with clarity, I created a data-driven prioritization framework to objectively assess and quantify my roadmap investments. Here is a step-by-step breakdown of how I achieved this.
1) Defined a customized product value Vs. complexity framework
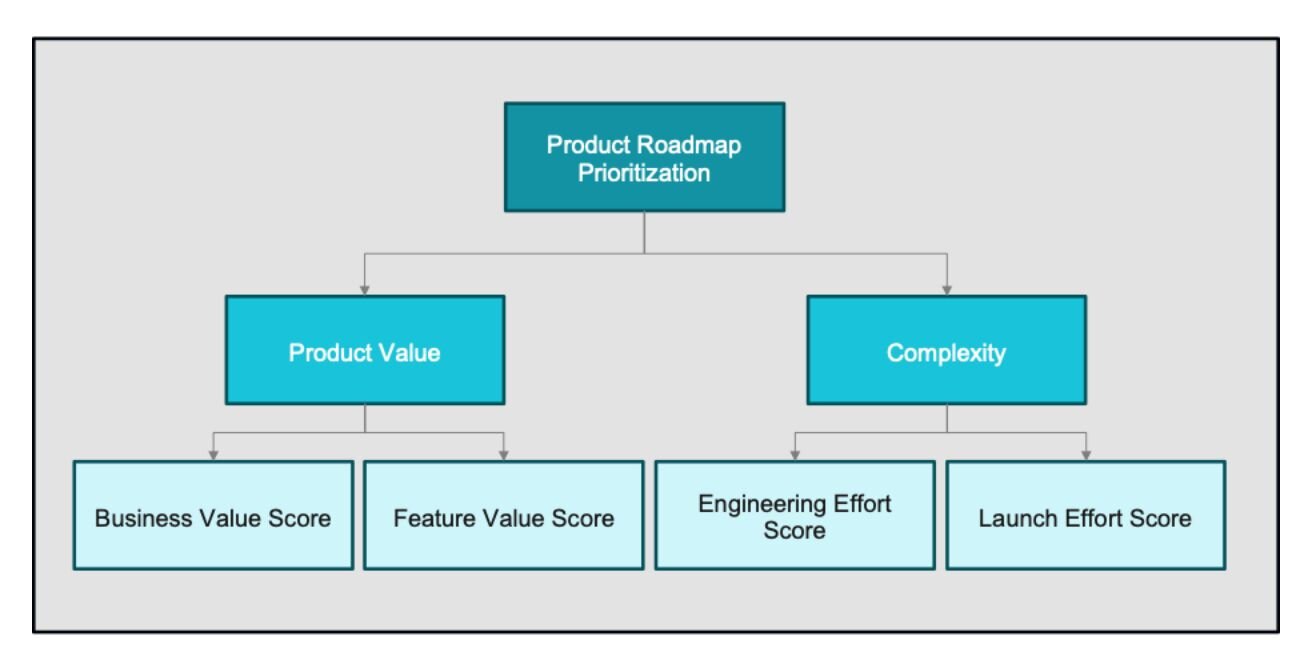
I decided to formulate a customized version of the product value vs. complexity framework to align with the unique dynamics of my business needs. I defined sub-categories under Product value and Complexity and defined scoring parameters:
a) Product value category
Business Value:
In this category, I quantified the strategic importance of the product to the business. I defined scoring parameters such as:
o Number of customers: Denotes the total number of unique active customers for the product in the past year.
o Year over year (YoY) customer churn rate: Denotes the total number of customers who have uninstalled the product.
o YoY growth in new customers: Denotes the growth rate of the product. Is the product growing exponentially YoY or has growth tapered off?
o Product revenue: Denotes the total net revenue generated by the product in the past year.
Feature Value:
In this category, I wanted to double down on quantifying the importance and urgency of building the new features of the product. I defined scoring parameters such as:
o Number of customers who requested the feature: I also accounted for bonus points if the requests came from the top 20% of customers who contributed to 80% of the product revenue (Pareto’s 80/20 principle)
o Revenue uplift: What is the expected increase in product revenue if we were to launch this new feature? This can be estimated based on the spend size of customers who requested the feature.
o Urgency of the request: Is the customer’s workflow broken? Is there an unaddressed security vulnerability? Or is it a nice-to-have feature?
o Feature redundancy: Are there other internal or partner teams who plan to build this feature? What is the timing of the release of the redundant feature? For instance, while another internal team may have this feature on their two-year roadmap, releasing our version of the product feature early can accelerate value realization for customers.
o Innovation: Is this an industry-leading or pioneering feature (e.g. a GenAI use case)? Will the feature be a technological breakthrough for the product and the business?
b) Complexity category
Engineering Effort:
Under this category, I quantified the effort required to complete feature development and defined scoring parameters such as:
a. Number of developers needed: Denotes the total number of engineers needed to complete the feature work
b. Engineering time investment: Denotes the total number of weeks needed to complete design, development, and testing.
Launch Effort:
I created this category to quantify the “last lap” effort required to launch the feature to customers, beyond the development effort. I defined scoring parameters such as:
c. Time required for scoping and hardening phases: This includes the number of weeks needed to conduct customer research, complete A/B testing, design the user experience for the product, author product requirements document, get leadership/stakeholder buy-in and complete legal and security reviews.
d. Customer training/onboarding effort required: Includes the time taken to complete user acceptance testing, author user guides, and conduct training for field and customer account teams.
e. Product support effort: This includes the time needed to set up a dedicated support team, create playbooks and troubleshooting documentation, and train the team to meet the SLA commitments.
2) Created a scoring rubric
Now that I had defined various scoring categories that mattered to my product, next I set out to create a rubric to define the scoring scale and categorize what each value meant. I ensured that all categories were scored on the same scale, such as 1 to 20, so that I could weigh them equally. Here is an example of a scoring rubric I had created (but with fictitious numbers):

This is where it gets quite subjective. I reviewed the revenue range for all my products and took a scale that worked best for my products. Your scoring parameters and rubric might be completely different depending on your product category (e.g. B2B or B2C), industry, and unique traits of the business positioning of your products.
3) Gathered data, scored the products
Next, it was time for me to gather every single data point related to the product and bring together my analyses – from customer research, product metrics, engineering effort estimation conversations, and more – to score all the products for the scope of its next planned release. At the end of this exercise, I had the product value and complexity scores for every single product release, for my portfolio of 20 products.
4) Segmented products based on score and ruthlessly prioritized

I mapped the product releases to a graph with Product Value on the Y axis and Complexity on the X axis, to categorize products based on 4 quadrants:
· Strategic investments: Product releases that fall into the high value, high complexity quadrant were my strategic bets. Examples include new product investments and high-stakes AI investments.
· Quick wins: Product releases that are high value and less complex to build fall into this quadrant. Examples include incremental features to existing products that delight customers and generate business value, such as a notification mechanism, filter option for a dashboard, or a single-click export option.
· Keep the lights on: Product releases that generate low value and are low effort to maintain fall into this quadrant. These products would eventually be on a deprecation path until we find better alternatives for customers. The releases under this category include minor UI fixes and security patches.
· Futile pursuits: This quadrant includes initiatives that demand high effort while yielding low returns. I call them futile pursuits because the effort invested does not generate meaningful business value. Using this scoring exercise, I was able to clearly identify the product releases that were draining engineering capacity without contributing to our strategic goals, making it easier to deprioritize or eliminate them from the roadmap.
After categorizing all product releases using the Product Value vs. Complexity framework, I built a prioritized annual roadmap that allocated 70% of my organization’s time to strategic bets, 20% to quick wins, and 10% to keeping the lights on categories.
Conclusion: To building better roadmaps
By applying this structured, data-driven prioritization methodology, I transformed what once felt like an overwhelming and ambiguous exercise into a clear, repeatable decision-making framework. The Product Value vs. Complexity framework not only helped me quantify trade-offs across a diverse portfolio of 20+ cloud-native B2B products but also equipped me with the analytical data to communicate a compelling and defensible roadmap to executives, engineering leaders, and go-to-market teams. Most importantly, it enabled my team to focus our limited resources on initiatives that truly moved the needle—doubling down on high-impact strategic bets, delivering quick wins that delighted customers, and minimizing investment in low-value work.
Keep reading
Resetting product priorities with a strong UX vision
Why Friction Maxxing changes product strategy in 2026
Three methods I've used to make better product decisions
The invisible middle — how mid-level bias distorts strategy