

There are few things more disappointing than watching a carefully planned roadmap implode because of a late‑stage production bug. I’ve been there: approving a feature for production release, only to spend the next few days firefighting. What if, instead of ignoring quality signals until they bite, we used QA metrics to steer our product strategy?
The silent killer in product roadmaps
Early in my career as a QA lead turned product manager, I championed a customer‑requested reporting dashboard. But two days before launch, a critical aggregation bug emerged in production, one our test suite never caught. Overnight, our roadmap fell apart as engineers scrambled to patch and stakeholders grew anxious over missed deadlines. . Most product managers track customer usage, revenue impact, and strategic themes—but few also fold QA metrics into their decision making. As a result, risk accumulates silently.
Defect density increases, more bugs slip through to production, and regression rates rise - and all of this- outside the PM’s radar. By the time alarms sound, you’re already off‑schedule and over‑budget. It doesn’t have to be this way.
In the sections that follow, I’ll bridge the PM‑QA divide with a simple framework, a dashboard mock, and a sprint‑level pilot plan to use quality metrics as strategic signals.
It will help keep your roadmap resilient and focused on real value, so you and your team can achieve smooth, confident deployments.
Bridging QA and product management
For much of my career, I’ve been on both sides of the fence—first in quality assurance, then in product management. That dual perspective taught me a powerful truth: QA isn’t just about finding bugs; it’s about finding signals. Signals that, if elevated early enough, can save product teams from costly missteps.
The trouble is, PMs and QA teams often speak different languages. QA reports defects; PMs prioritise features. And somewhere in between, product risk quietly builds. But what if we didn’t treat quality as an afterthought? What if we integrated it into the earliest stages of roadmap planning with real, measurable indicators?
That’s where the “quality as strategy” mindset comes in. By tracking a focused set of QA metrics - just the ones that matter - and mapping them to roadmap components, you begin to spot patterns. You start asking sharper questions: Why is this module’s defect density climbing faster than others? Are we repeatedly revisiting the same functionality in post‑release fixes? Which features are “at risk” not because of design flaws, but because they sit atop unstable code?
The QA-strategy matrix
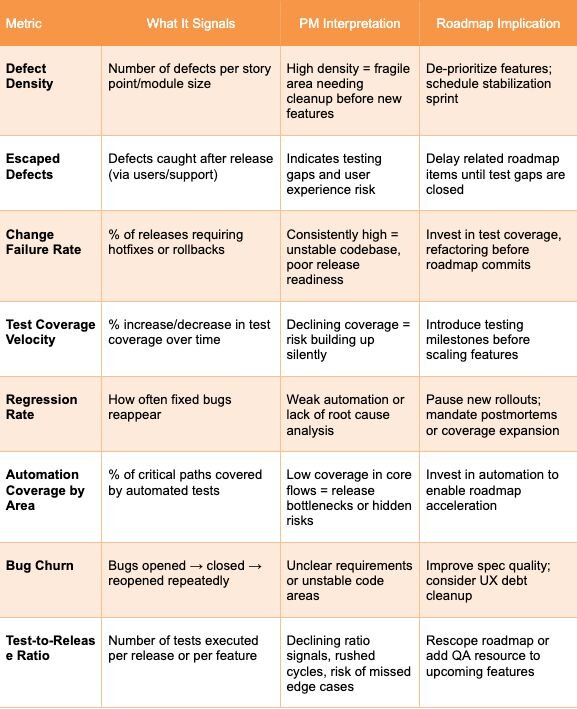
At the heart of this approach is a simple and powerful decision-support tool: the QA-strategy matrix. This matrix scores candidate roadmap items such as features, modules, or tech initiatives—against four key QA metrics:
- Defect density: How many bugs per feature area or code size?
- Regression rate: Are we breaking things we’ve already shipped?
- Test coverage: Do our automated tests actually touch this part of the product?
- Escaped defects: How many bugs made it to production—and how severe were they?
Each metric is color-coded or scored from Low → Critical, with clear thresholds that can be tuned by the team.
For example, anything with escaped defects above three in the past two sprints might trigger a “High Risk” flag.
The beauty of this matrix is in what it enables. Instead of PMs and QA debating priorities in the abstract, this gives them a shared artefact—data-backed, visual, and time-sensitive.
Mock dashboard for strategic insights
Data is only useful if it’s accessible, especially for product managers who aren’t knee-deep in testing reports. That’s why I created a simple dashboard mockup designed to surface QA metrics in a way that supports strategic decisions.
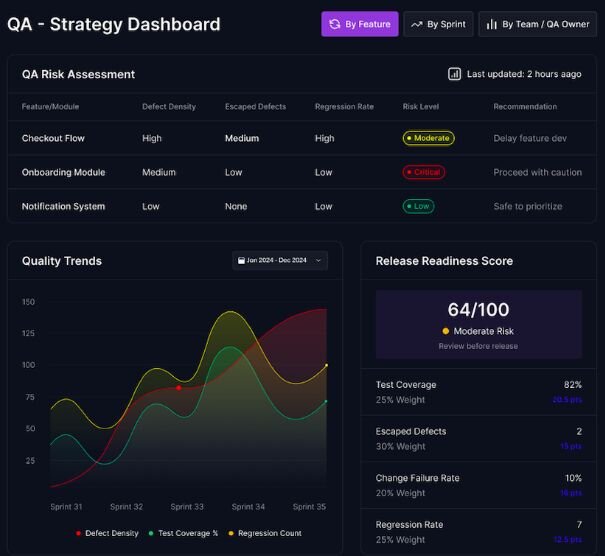
The layout is built around three core areas:
- High-risk areas: A visual snapshot of product modules or features flagged as high-risk, based on defect trends, regression rates, or low test coverage. Example: “Payments module – High regression rate, declining test coverage.” PM impact: Delays flashy roadmap additions if core stability is at risk.
- Trendlines over time: Graphs showing how QA signals are evolving sprint over sprint. Are regressions going up? Has escaped defect volume improved after recent refactors?
PM impact: Helps track the “cost of stability” and time quality investments right.
- Readiness score per feature: A combined quality-readiness index tied to upcoming roadmap candidates.
- Example: Feature A = 82% readiness; Feature B = 48% (due to legacy dependencies).
- PM impact: Encourages risk-aware prioritization and clearer stakeholder comms.
This kind of dashboard doesn’t require heavy engineering to prototype. You can build a lightweight version using Google Sheets, Looker Studio or your test management tool’s reporting feature. What matters most is the habit of making these signals visible during planning.
Mini use case: when quality changed the roadmap
Let’s say you’re a product manager working on a fintech platform. Two features are up for prioritization in the next cycle: Feature A: A sleek new customer dashboard with high visibility and strong stakeholder pressure behind it. Feature B: An enhancement to your payouts module—less glamorous, but with real usability complaints piling up.
When you consult your QA dashboard: The payouts module shows a high regression rate and low-test coverage. Your QA strategy matrix marks it as “critical risk.” Escaped defects from this module caused two support escalations last sprint.
In contrast, the customer dashboard sits on top of well-tested, stable architecture. Faced with these signals, you make a call: deprioritize Feature A by one sprint and instead invest in shoring up payouts. You loop in your engineering lead and together you allocate a week to increase test coverage and refactor risky areas. Two sprints later, you ship the new dashboard—on time and without drama—because the foundation is now stable.
Pilot it in one sprint: how to test this with your team
You don’t need a fancy platform or org-wide buy-in to start using QA metrics strategically. All you need is one sprint—and a curious mindset. Here’s how to run a low-lift pilot that brings this approach to life.
Step 1: Pick 2–3 roadmap items or backlog candidates. Ideally, choose items that vary in technical complexity or module stability. This gives you contrast.
Step 2: Score them using the QA-strategy matrix. Partner with your QA lead (or engineer if you don’t have formal QA). Assign qualitative scores for: defect density, regression rate, escaped defects, test coverage. Don’t aim for perfection—just get a directional signal.
Step 3: Bring the matrix into sprint planning. Present the scores alongside usual prioritization factors (e.g. user impact, stakeholder pressure, revenue potential). Ask: “Is this feature’s underlying quality ready to support fast, stable delivery?”
Step 4: Track outcomes. At the end of the sprint, reflect:” Did we avoid quality surprises?”
Step 5: Iterate. Refine the thresholds. Add trendlines if useful. If it works, propose integrating it into your broader planning cadence.
What you’ve just done: Run a time-boxed experiment to shift quality from reactive to strategic, without waiting for executive mandates or platform rebuilds.
Why this matters: elevating quality from hygiene to leverage
Most product teams treat quality like plumbing: invisible when it works, disruptive when it doesn’t. It shows up reactively—in bug bashes, in sprint retros, in late-night firefighting. But what if we moved it upstream?
Quality, when made visible early, becomes leverage. It lets you push back on risky roadmap asks with data, prioritize tech debt with clarity, and align cross-functional teams around readiness, not just desirability.
In my own QA-to-PM journey, I’ve seen how much context PMs lose when quality signals are buried in test reports, isolated in Jira, or worse, only felt after launch. We need tools that surface this information before it becomes painful. It’s about creating a common language, where PMs and QA can jointly say, “Here’s what’s risky, here’s what’s ready, and here’s what we’re willing to bet on.”
And once you adopt this perspective, you start seeing everything differently. That neglected module? Maybe it’s quietly bleeding user trust. That high-velocity squad? Maybe it’s racking up silent regressions. This model gives you the x-ray view, so you can choose strategy over scramble.
Taking it forward: small shifts, lasting impact
You don’t need executive buy-in, a new tool or a six-month initiative to get started. You can begin with just a spreadsheet, a planning meeting, and one good QA partner.
Here are three ways to bring “quality as strategy” into your practice this quarter:
- Run a pilot with one squad or stream. Using the matrix in your next planning session, score a few backlog items, discuss results, and note whether it changes how you prioritize.
- Create a lightweight quality dashboard. A shared Confluence page or Looker Studio view is enough, the key is visibility.
- Build a repeatable review ritual. During sprint reviews or retros, ask: “What quality signals would’ve helped us decide better last time?”
Over time, this approach scales naturally. You’ll find yourself referencing quality signals more often during trade-offs. Engineers will feel more heard. Stakeholders will get fewer surprises. And your roadmap will quietly become more durable because you’re shaping it with eyes wide open.
That’s the whole point: better decisions, made earlier.
Ready to try it? Start with the QA-strategy matrix. Use it in your next planning cycle. If it changes even one prioritization decision for the better, it’s done its job.
After all, strategy isn’t just about vision. It’s about what you choose not to build and why. Let quality help you make that call.
Keep reading
A practical guide to goal-setting and roadmapping
How to plan your year with hypotheses instead of guesses
How to craft a product vision: Ebi Atawodi at #mtpcon London 2025 (Director of Product, YouTube)
Why most product roadmaps fail: Phil Hornby (Product Leadership Coach) – ProductTank Porto