
Earlier in my career, I believed that green metrics meant healthy product design. If tickets were closing, SLAs were stable, and escalation volume wasn’t rising, I assumed the product experience was improving. On paper, everything looked healthy. Dashboards were calm. Operational noise felt contained.
It wasn’t.
What we were improving was our ability to respond quickly to friction. We were not reducing the friction itself. The same workflow confusion resurfaced. The same setup misunderstandings reappeared. The same configuration dependencies created repeat questions. Each case was handled correctly. Customers were unblocked. Nothing was technically broken. But nothing fundamentally changed.
That realization forced an uncomfortable shift in perspective. Resolution is not the same as improvement. When you confuse the two, you begin accumulating what I now call friction debt.
When resolution looks like success
Recurring support friction is one of the most underestimated forms of product debt. It builds quietly inside resolved tickets, long before dashboards show obvious signs of trouble. Unlike technical debt, which shows up in performance regressions or architectural complexity, friction debt hides in operational efficiency. Everything looks stable precisely because support is doing its job well.
Product teams are rewarded for shipping. Support teams are rewarded for resolving. Engineering teams are rewarded for stability and reliability. Each function is incentivized to optimize its own domain. But no one is explicitly rewarded for eliminating recurring ambiguity in the experience.
As a result, tickets close. Reports look stable. Metrics remain green. Yet the same issues return week after week. Over time, customers adapt to unclear flows. Support compensates through detailed explanations. Engineering optimizes infrastructure. The underlying experience, however, does not materially improve.
Friction debt compounds silently. And because it rarely creates dramatic failure, it often escapes executive attention.
What support sees that product often misses
Support teams experience your product in its least polished form. They see it misconfigured, misunderstood, stretched beyond intended use cases, and interpreted without internal context. They see the version of your product that customers actually use, not the one presented in marketing copy or internal demos.
In one environment I worked closely with, a feature was introduced behind a toggle. Turning it on made the feature visible in the interface. But it would not function unless a secondary permission setting was configured. The dependency was documented. It simply was not obvious during activation.
From a product dashboard perspective, activation appeared strong. Usage metrics were trending upward, and no system errors were recorded. The launch looked successful.
At the same time, support was seeing a recurring pattern: “I turned it on, but nothing happened.”
Each ticket was straightforward to resolve. Engineers walked customers through the missing configuration step. Cases closed quickly. SLA targets were met. Escalations remained low.
But when activation data and support themes were reviewed side by side, the pattern became impossible to ignore. Activation was rising. So was confusion. Nothing was technically broken, yet expectations were misaligned with actual system behavior.
Because every ticket was resolved successfully, the pattern never escalated to product leadership. It stayed within support operations. That is how friction debt accumulates: quietly, repeatedly, and invisibly across functional boundaries.
Why dashboards give you false confidence
Product analytics measure behavior. They do not measure comprehension.
Activation tells you that something was enabled. It does not tell you whether the user understood what enabling it required. Engagement shows usage patterns. It does not reveal the friction that preceded adoption. Churn reflects dissatisfaction once it matures. It does not illuminate where confusion originally emerged.
Support often sees structural design friction weeks or months before product metrics shift. The challenge is not lack of information. The challenge is that the information lives in separate systems and separate conversations.
Product ships features. Support resolves confusion. Engineering stabilizes systems. Without deliberate integration, recurring friction gets handled operationally instead of strategically.
Organizations then mistake operational efficiency for product health. That false confidence delays necessary redesign.
The friction gap
Friction debt creates a widening gap between what dashboards indicate is working and where customers repeatedly struggle. Analytics shows measurable behavior. Support reveals lived friction.
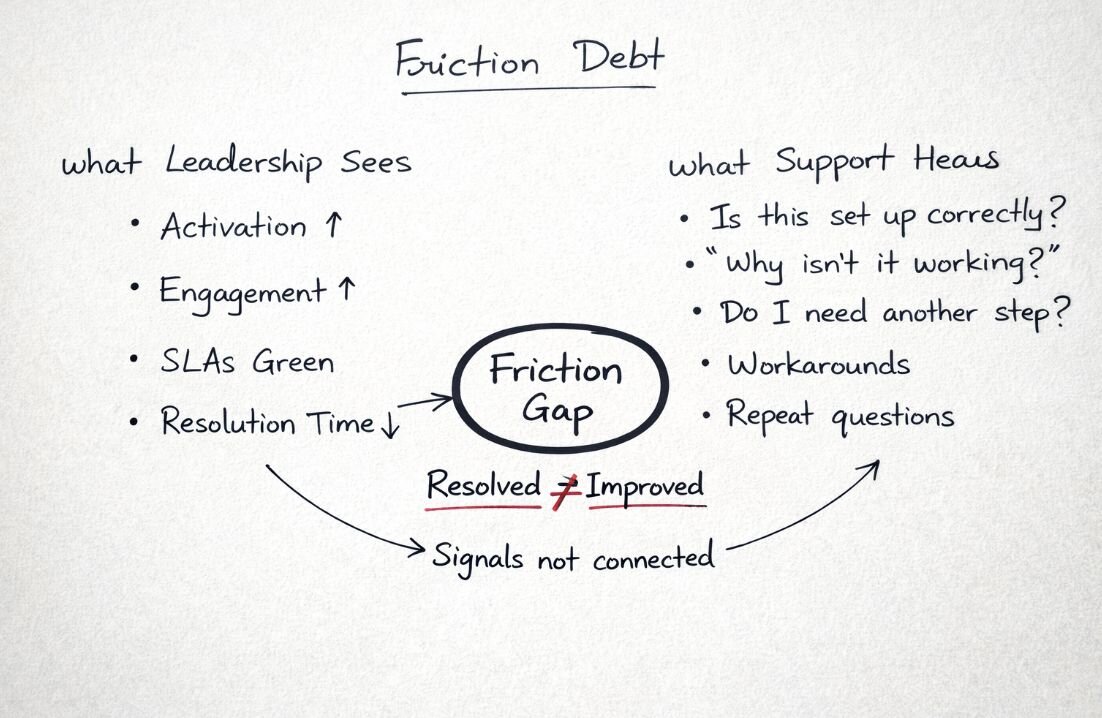
Figure: The Friction Gap — When leadership metrics and support reality aren’t connected.
If adoption is rising while clarification questions increase, there is a gap. If engagement metrics look healthy but similar confusion appears every week in tickets, there is a gap. If tickets close quickly yet the same issue resurfaces across releases, there is a gap.
The wider that gap grows, the further your roadmap drifts from actual customer experience. Most organizations do not lack data. They lack a structural mechanism for translating operational signals into product decisions.
Silent friction is more dangerous than loud failure
Not all friction produces visible spikes.
In another product environment, a feature required a multi-step configuration process. Nothing was technically broken. Users could complete the process successfully. Yet many skipped the final step, leading to incomplete setups that behaved unpredictably.
Adoption metrics were acceptable. Completion rates were within tolerable thresholds. No single KPI triggered alarm.
Support conversations, however, revealed recurring uncertainty. Users believed they were finished when they were not. The issue was not system failure. It was design complexity layered across multiple steps.
When the setup flow was simplified and redundant steps removed, support tickets declined, and usage stabilized. The signal had always been present. It simply required connecting operational observation with product metrics and acknowledging that “good enough” metrics were masking recurring friction.
How to actually reduce friction debt
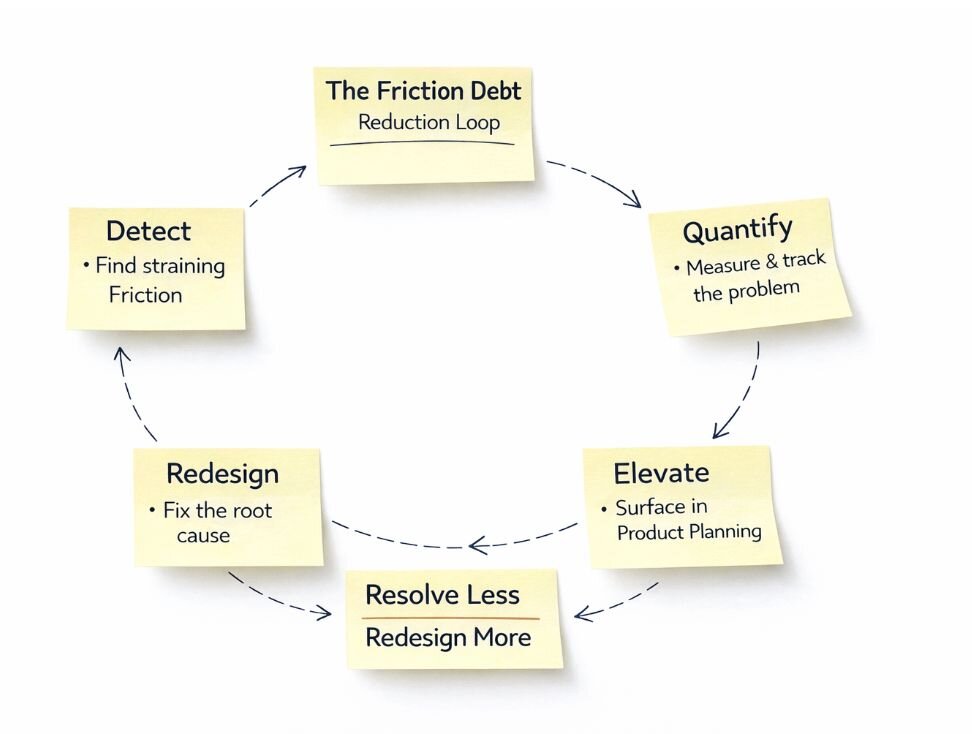
Friction debt does not disappear when tickets close. It disappears when recurring confusion changes what gets prioritized on the roadmap.
That requires a deliberate feedback loop.
1. Detect recurring friction
Most teams track ticket volume, SLA compliance, and resolution time. Those metrics measure responsiveness. They do not measure repeated ambiguity.
Instead, look for recurring patterns across releases and customer segments. If the same misunderstanding appears consistently, treat it as a structural design issue rather than background support noise. Repetition is rarely random. It usually signals unclear defaults, hidden dependencies, or mismatched expectations.
2. Quantify the pattern
Anecdotes rarely influence roadmap decisions. Patterns do.
Track frequency, affected segments, and impact on activation, adoption, or retention. Connect friction themes to measurable product outcomes. When confusion is quantified, it becomes harder to dismiss as “just support volume.”
3. Elevate friction into product forums
Support themes should not remain isolated within support dashboards. Recurring friction patterns must be reviewed alongside activation, engagement, and growth metrics in product planning sessions.
When friction trends sit next to growth metrics, trade-offs become visible. When they do not, roadmap decisions skew toward expansion over simplification.
If friction is not visible where prioritization happens, it will not influence direction.
4. Redesign the root cause
Friction debt accumulates when recurring confusion is handled repeatedly but never eliminated at the source.
Assign clear ownership for translating operational insight into product change. That role may sit within product operations, support leadership, or within product management itself. The structure matters less than accountability.
Without explicit ownership, friction gets resolved efficiently. It does not get redesigned intentionally.
The bottom line
Resolved tickets do not prove product health. They prove that your support organization is capable and responsive. Friction debt forms when recurring confusion is handled repeatedly but never eliminated at the source. Product sees activation. Support sees friction. Engineering sees stability. The full picture only becomes visible when those perspectives are integrated deliberately.
You do not need more dashboards. You need better translation between the ones you already have.
Recurring support friction is not operational overhead. It is one of your earliest indicators of product truth. Ignore it, and friction debt compounds quietly beneath green metrics. Elevate it, and it becomes a lever for durable product improvement.