

How structural interaction design shaped product logic, analytical workflows, and decision-making in a domain-heavy B2B platform.
Designing for complex B2B systems often exposes a fundamental tension in product work: the interface may look intuitive, yet the underlying system remains perplexing to users. In domains like climate technology and supply chain infrastructure, workflows are rarely linear, and traditional UI patterns struggle to represent systemic logic. When the structure of the product does not reflect the structure of the domain, alignment breaks down — between teams, stakeholders, and ultimately, users.
This was the challenge we faced while designing Trade Flow Builder at Kinertic — a system intended to model and manage complex trading flows within climate-focused supply networks.
In early-stage startups, these patterns become especially visible. Teams are forced to make architectural and design decisions long before they have sufficient data, access to real users, or the ability to validate assumptions in a meaningful way. Decisions made at this stage are rarely the outcome of perfect information — instead, they reflect how a team balances strategy, experience, risk, and uncertainty under real constraints.
This dynamic becomes even more pronounced in domain-heavy B2B platforms, where product decisions directly shape business logic, data structures, and long-term scalability. In such contexts, design choices go beyond usability or visual clarity — they influence how the product can evolve, which questions it can answer, and which trade-offs become harder to revisit over time.
This case explores one of those decisions made at Kinertic: how we approached the design of a Trade Flow Builder for modelling complex, multi-tiered supply chains — and why a visual, canvas-based approach became one of the key elements of the product rather than a surface-level interface choice.
Seen from the outside, this decision could be interpreted as a UI or interaction choice. In practice, it emerged from a much deeper product problem — one that sat at the intersection of domain complexity, data structure, and early-stage uncertainty.
Part 1: Understanding the problem behind trade flows
At Kinertic, we are building a platform for modelling and analysing emissions across complex supply chains. These supply chains are inherently multi-tiered, involve multiple actors, and evolve depending on procurement strategies, transport modes, and commercial scenarios.
From the beginning, several challenges existed in parallel. Calculation accuracy, data availability, and data quality were critical parts of the system, requiring close collaboration between product, engineering, and domain experts. At the same time, another challenge emerged on the product side: how to represent trade flows in a way that made them understandable, editable, and comparable for different types of users — not only analysts, but also commercial and operational stakeholders, and for different companies along the value chain with varying business models.
Most existing approaches treat supply chains as static structures or flattened tables. While sufficient for reporting and auditing purposes, these representations make it difficult to explore alternatives, model scenarios, or reason about how changes propagate across the system. For a product intended to support decision-making under uncertainty, this creates a practical limitation rather than a purely visual one.
This framing shaped how we approached the problem. Before designing specific screens or interactions, we needed a model that reflected how trade flows behave in reality.
Part 2: From data structure to interaction model
As the team explored different ways of modelling trade flows, it became clear that the challenge was not only about how data was stored or calculated, but also about how people could reason about it. Trade flows rarely exist as linear sequences. Instead, they form branching structures where products, suppliers, and multiple origin points connect to a final destination across various tiers. The team needed a way to make the entire supply chain visible and understandable at once — especially when it spanned multiple tiers and relationships. Without this visibility, even small changes became hard to understand in context. Adjusting a supplier, changing volumes, or restructuring a connection could break the coherence of the entire flow, making it harder for users to predict downstream effects.
At the same time, we knew that the product would eventually be used not only by technical specialists. The expected users were domain experts in sustainability, procurement, and operations — people with deep knowledge of supply chains, but not necessarily experience working with data models, schemas, or abstract configurations.
This created a design constraint: the system needed to handle complex trade flow logic internally while remaining understandable and approachable for non-technical users. During early exploration and brainstorming sessions, another insight emerged. The ability to represent entities as connected nodes mirrored how the team already reasoned about trade flows conceptually — not as sequences, but as trees. The interface therefore needed to support this mental model rather than force users into tabular or sequential representations.
This shifted the discussion from interface preference to product reasoning. The question was no longer whether a visual interface would look clearer, but whether it could help users maintain an accurate mental model while working with multi-dimensional model. A visual representation made relationships explicit, reduced cognitive load, and allowed users to understand both the structure and the consequences of change in a single view.
By “canvas-based approach,” I refer to an interactive modelling environment where users can visually construct and manipulate supply chain structures as connected nodes and flows. Instead of navigating through linear forms or static tables, teams work within a dynamic workspace that reflects the system architecture itself — allowing them to explore scenarios, dependencies, and trade-offs directly on the model.
At this stage, the canvas-based approach started to emerge not as a design trend or aesthetic decision, but as a practical response to the structure of the problem itself. The interaction model followed the logic of the domain: nodes connected to other nodes, forming expandable and modifiable structures that users could navigate and reshape directly.
Part 3: Designing interaction without losing structural context
As the canvas-based approach started to take shape, the next challenge was not visual representation itself, but interaction. The goal was not simply to display trade flows, but to make them editable without breaking the user’s understanding of the overall structure.
While trade flows could be created either manually or through data ingestion, the Trade Flow Builder was primarily designed to support manual construction. Users needed to be able to build trade flows from scratch — defining origin points, selecting products, configuring logistics, and specifying the final destination point — while maintaining a clear understanding of how each element related to the rest of the system.
This raised an important interaction question: how do you allow detailed editing without compromising structural clarity? The solution was to keep the canvas focused on representing the structure of the trade flow as a whole, while moving configuration into a contextual side panel. Selecting any node opened its parameters in the panel, where attributes could be modified without disrupting the visual coherence of the canvas.
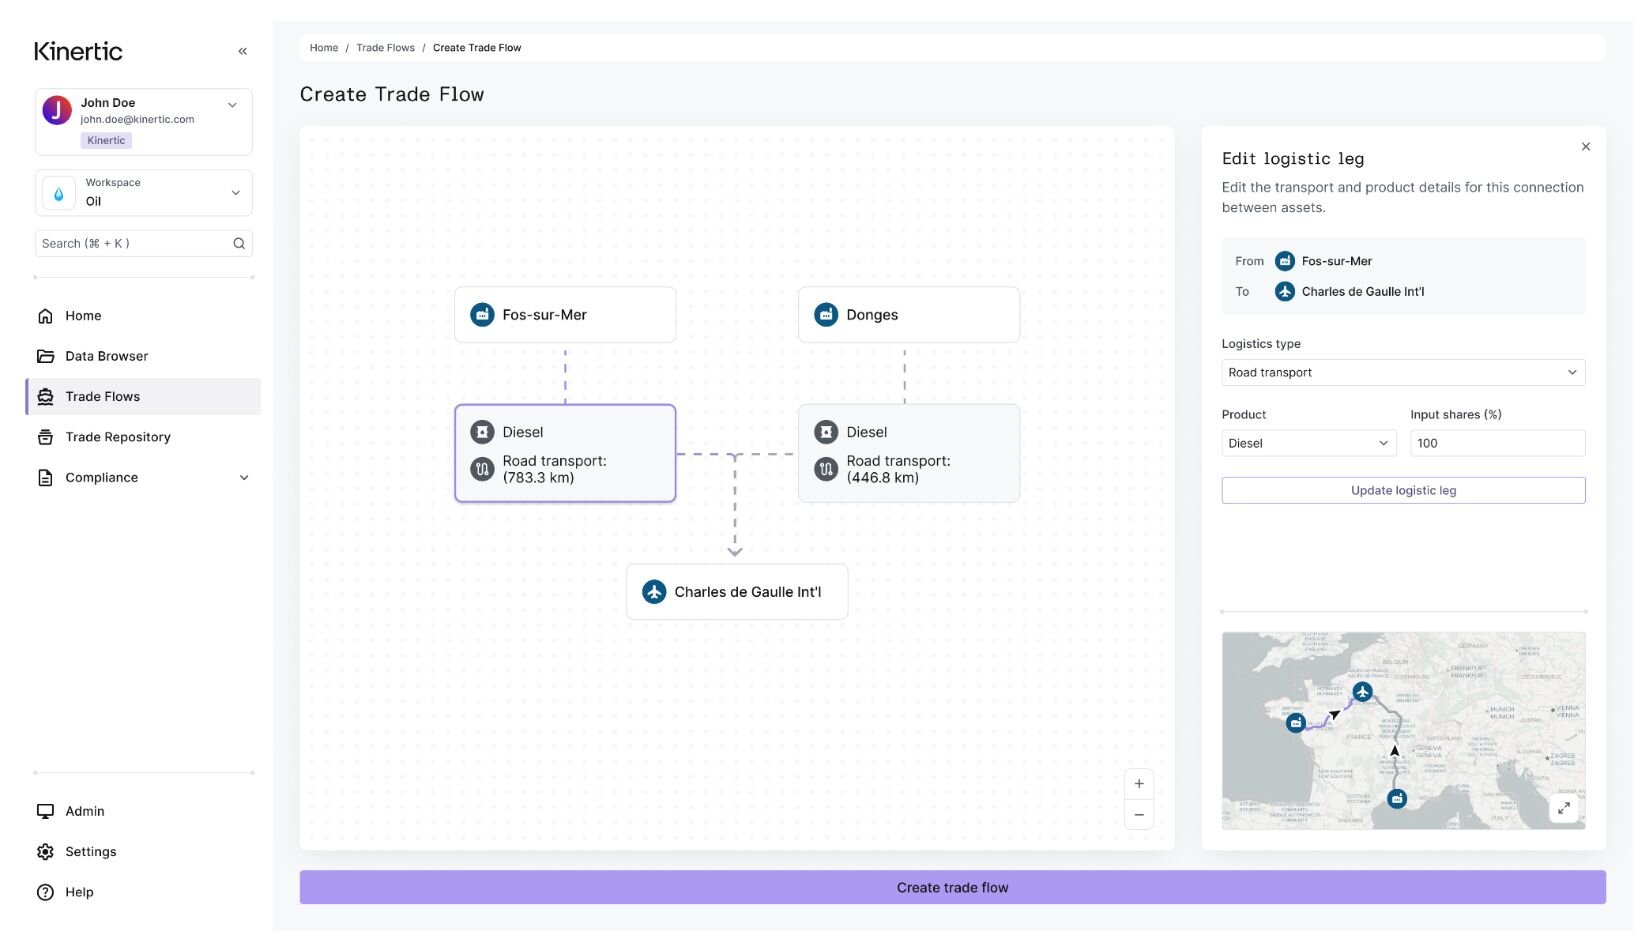
This separation helped preserve readability. Complex trade flows contain a significant number of attributes, and embedding all editable controls directly inside the canvas would have quickly introduced visual noise. By keeping the canvas dedicated to relationships and hierarchy, the interface maintained clarity while still supporting detailed configuration.
At the same time, modifications made during editing — whether changing an origin or destination point, adjusting logistics, updating product parameters, or refining other structural elements — were immediately reflected within the canvas editing state. This allowed users to see the impact of their decisions in real time and validate changes visually before saving them, without losing orientation within the broader structure of the trade flow.
Because the layout followed the structure of the trade flow rather than manual positioning, the canvas behaved less like a drawing surface and more like a modelling environment. Users were not arranging elements visually; they were shaping a system whose structure remained consistent as it evolved.
Importantly, nodes and connections were not freely movable by users. Their positions were automatically computed based on the structure of the trade flow itself. This was a deliberate decision: allowing free-form layout would have turned the canvas into a drawing tool rather than a modelling system. By keeping the layout structured and system-generated, we reinforced the “scientific” nature of the model — where changes are made through defined parameters and forms, not by visually rearranging elements.
Over time, this reinforced the earlier insight: the canvas was not introduced as a visual enhancement, but as a way to align interaction with the underlying logic of trade flows themselves.
Part 4: Why structure became a product decision
The decision to use a structure-driven layout was not a visual preference but a product decision shaped by the nature of trade flows themselves. Trade flows are inherently multi-layered and already complex. Introducing a fully free-form canvas would have increased flexibility, but also the risk of inconsistency, misinterpretation, and cognitive overload when modelling supply chains.
Instead, the layout follows the underlying logic of trade flows. Positions on the canvas reflect structural relationships rather than personal arrangement. This reduces ambiguity and helps ensure that flows remain readable, comparable, and analytically meaningful as their complexity increases.
Following the MVP launch, the Trade Flow Builder becomes more than a configuration tool — it acts as a bridge to trade flow analytics. Once a trade flow is created and saved, users gain access to detailed analytical insights associated with that specific trade flow. They can evaluate it across multiple levels — including total carbon intensity as well as contributions from logistics, Refinery, and other stages — based on data provided by external data partners.
As a result, modelling and analysis become part of a single workflow. Users construct a trade flow, review its analytical outcomes, and iterate by modelling alternative scenarios — for example, adjusting origin points or logistics to reduce carbon intensity. The Trade Flow Builder therefore functions as an entry point into decision-making rather than simply a way to describe existing processes.
One of the key learnings from this project is the importance of grounding design decisions in domain expertise. Stakeholders with deep knowledge of trade flows provide critical context that shapes how structure should be represented and constrained. While alternative interface approaches are possible from a purely design perspective, aligning the solution with domain logic ensures that the product reflects real-world workflows and expectations. In complex domains, this alignment often matters more than interface flexibility itself.
Part 5: Conclusion
This project reinforced an important principle in my work: design decisions should not only improve usability, but also help teams make better product decisions. By reframing the challenge from an interface problem into a modelling and decision-making problem, the team was able to reduce operational complexity while increasing confidence in how trade flows were created, analysed, and iterated.
For me, product design at this level means taking ownership not only of interaction quality, but of how problems are defined and solved across product, engineering, and business contexts. When design helps align system logic, domain constraints, and product goals, it becomes a driver of clarity and direction — not just execution. This is especially critical in early-stage environments, where design decisions directly shape how a product evolves over time.
In complex domains, interaction models should emerge from system structure rather than interface preference. When design reflects how a system actually behaves, visualisation becomes a tool for reasoning rather than representation. This allows product teams to reduce ambiguity, align stakeholders around shared mental models, and make decisions with greater confidence as products evolve.
This approach becomes particularly relevant for teams working in complex or emerging domains, where product structure often defines future decision space.