

Introduction
Every SaaS company struggles with a flood of custom report requests. The BI team is overburdened, and customers are frustrated by long wait times. What if you could cut custom report requests by 60% while improving customer satisfaction? Here’s how our reporting and analytics product team under my leadership at a visual collaboration startup tackled this. Our goal was to empower customers with real-time, self-service insights without relying on custom reports. This article shares the step-by-step framework we followed to build scalable self-service reporting, along with real-world examples to demonstrate how you can improve customer-centric data access and efficiency within your own organization.
Step 1: Align teams on a single source of truth
The challenge
Data fragmentation and inconsistent definitions across teams led to conflicting reports, causing confusion and misinformed decision-making. Stakeholders across departments used different calculations for key performance indicators (KPIs), leading to inefficiencies.
The solution
- Under my leadership, our Reporting and Analytics product team initiated workshops with cross-functional teams – including product, customer success, sales, and engineering—to define a single source of truth for core metrics.
- Created a metrics dictionary that outlined clear definitions, ownership, and governance policies for each KPI in the organization.
- Leveraged data catalogs and lineage tracking to ensure traceability and transparency in metric calculations. Our team conducted a thorough review of each metric and outlined how we came to the conclusion for the calculation keeping in mind about the future needs.
Outcome
- Achieved a 40% reduction in reporting discrepancies across teams.
- Increased trust in data accuracy, leading to improved decision-making.
Step 2: Redesign dashboards to drive self-service adoption
The challenge:
As customer demand for custom reports grew, our team encountered bottlenecks that slowed decision-making and overburdened BI team. The frequent ad-hoc requests for reports led to inefficiencies and delays in delivering valuable insights. Meanwhile, our existing dashboards—intended for self-service reporting—were underutilized and failed to meet customers' evolving needs.
The solution:
To address these challenges, my team and I conducted a thorough research phase with internal stakeholders and customers. Under my guidance, the reporting and analytics team held collaborative sessions with the customer success teams, solution delivery teams and sales teams to identify the most frequent report requests. By analyzing these insights, the team was able to pinpoint recurring themes in data needs, which helped us identify opportunities for improvement.
Additionally, our team worked closely with the BI team to audit their backlog, identifying commonalities and trends in report customization requests. This allowed us to understand the full scope of customer needs and operational constraints.
To maximize impact, our team prioritized the most influential customers—those with the highest reporting demands and strategic importance. By focusing on our top 10 strategic customers, we ensured that the most critical requirements first, creating a robust foundation for a broader solution.
Actions taken:
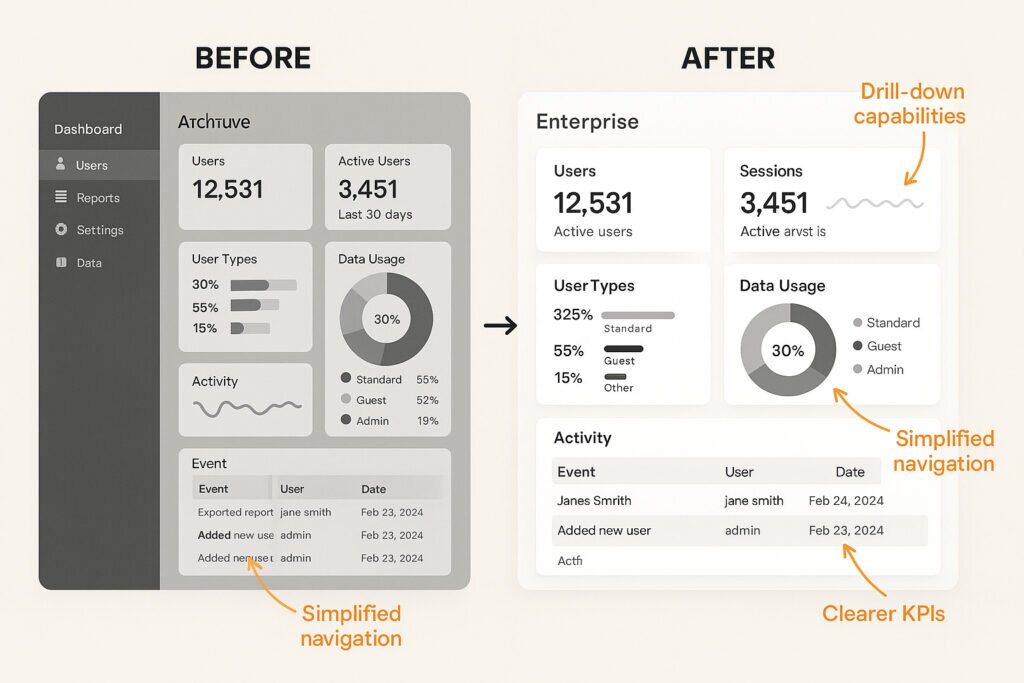
- Redesign of insights dashboards: Our team revamped the existing dashboards to be more intuitive and aligned with real-time data needs. Then we simplified the layout and made key performance indicators (KPIs) more accessible, ensuring that the data customers needed was easily understandable and actionable.
- Collaboration with BI team: Together with the BI team, our team streamlined the data architecture to ensure that the dashboards were built on standardized metrics. This reduced the need for frequent custom reports, freeing up resources for more strategic work.
- Enhancing functionality: Our team incorporated drill-down capabilities and advanced filtering options into the dashboards. This allowed users to explore data at different levels of granularity without having to request custom reports. Users could dive into more specific details when needed, increasing the dashboard's utility and flexibility.
- Preliminary legal and compliance considerations: While detailed data privacy and compliance checks were deferred to Step 5, we ensured that any redesigns took into account potential risks related to data privacy and security, including PII concerns.
Outcome:
- Increased efficiency: Our team saw a 60% reduction in custom report requests within the first six months. Customers were now able to independently access the insights they needed, freeing up the BI team to focus on higher-level analytical work.
- Improved adoption and engagement: By aligning the dashboards with real customer needs, we achieved greater adoption. Users felt more empowered to explore data at their own pace, which led to a 25% increase in customer satisfaction (CSAT) scores. Real-time insights became more accessible and meaningful, driving better decision-making.
- Reduced BI team workload: As more customers utilized the self-service dashboards, the BI team’s workload decreased by 30%, enabling them to focus on strategic initiatives and deeper data analysis rather than fulfilling one-off custom report requests.
Step 3: Automate reporting with APIs & smart integrations
The challenge:
Manual reporting processes were time-consuming, prone to errors, and often struggled to scale with growing data needs. Additionally, the varying frequency of reports and the need for real-time data access made it difficult to create a one-size-fits-all solution.
The solution:
Our team approached the automation challenge from two main perspectives:
- Understanding the user’s needs: At first, the reports that were most commonly requested by our user personas are identified. This helped us prioritize reporting features that directly addressed customer pain points.
- Evaluating the data’s volume and real-time requirements: Our team considered the technical challenges of managing large volumes of data and the varying frequency of reporting needs, with an emphasis on enabling real-time insights. Then we structured our solution to be flexible enough to accommodate both high-volume, infrequent reports and smaller, real-time data pulls.
To design a solution that worked across these needs, our team explored two primary methods: API integration and Excel download options. Then we identified the benefits and challenges of each, ensuring that we could deliver a seamless experience for all customers.
Actions taken:
- API integration for seamless data access:
Under my leadership, our team implemented API-driven access to allow customers to pull large datasets directly into their systems, ensuring real-time access to fresh data. This approach worked particularly well for customers with high-frequency needs and those requiring live data for operational decisions. - Excel download for simpler use cases:
For customers who did not require real-time data or had limited technical resources, our team provided the option to download reports via Excel. This solution allowed users to easily export data and perform ad-hoc analysis without needing to rely on complex integrations.
Outcome:
- 40% reduction in custom report requests, as customers could now access the data they needed through self-service solutions.
- Customers integrated data into their business systems with ease, significantly reducing manual reporting processes.
- Real-time reporting capabilities increased the value of the platform for operational decision-making.
Step 4: Monitor user interaction and improve iteratively
The challenge:
During the initial phase of delivery, our team tracked basic interactions, such as downloads and API requests, but these provided limited insights into the specific pain points users were experiencing. These basic metrics were helpful for understanding whether the solution was being accessed but didn’t provide the level of detail needed to refine the user experience or understand where users were struggling.
The solution:
To truly optimize the dashboard, our team needed to go beyond basic interactions and start capturing in-depth user behaviors. Then we began tracking more granular user actions, such as:
- Page transitions: How users navigate between different sections of the dashboard (e.g., from summary views to detailed drill-downs).
- Hovering actions: Identifying when users hovered over specific elements (such as charts or data points), indicating interest but not full engagement.
- Drilling down: Tracking when users clicked on specific data points to dive deeper into detailed insights (e.g., clicking on a KPI to view its historical data or breakdown by region).
- Filtering and sorting actions: Observing how users interacted with filters and sorting options, which helped us understand how they were customizing the data to meet their specific needs.
These in-depth interactions revealed insights into where users might be getting stuck or where features were underused. For example, if users hovered over a chart but did not click through to see more details, it could indicate that the call-to-action wasn't clear or that the chart wasn’t delivering the level of insight they expected.
Actions taken:
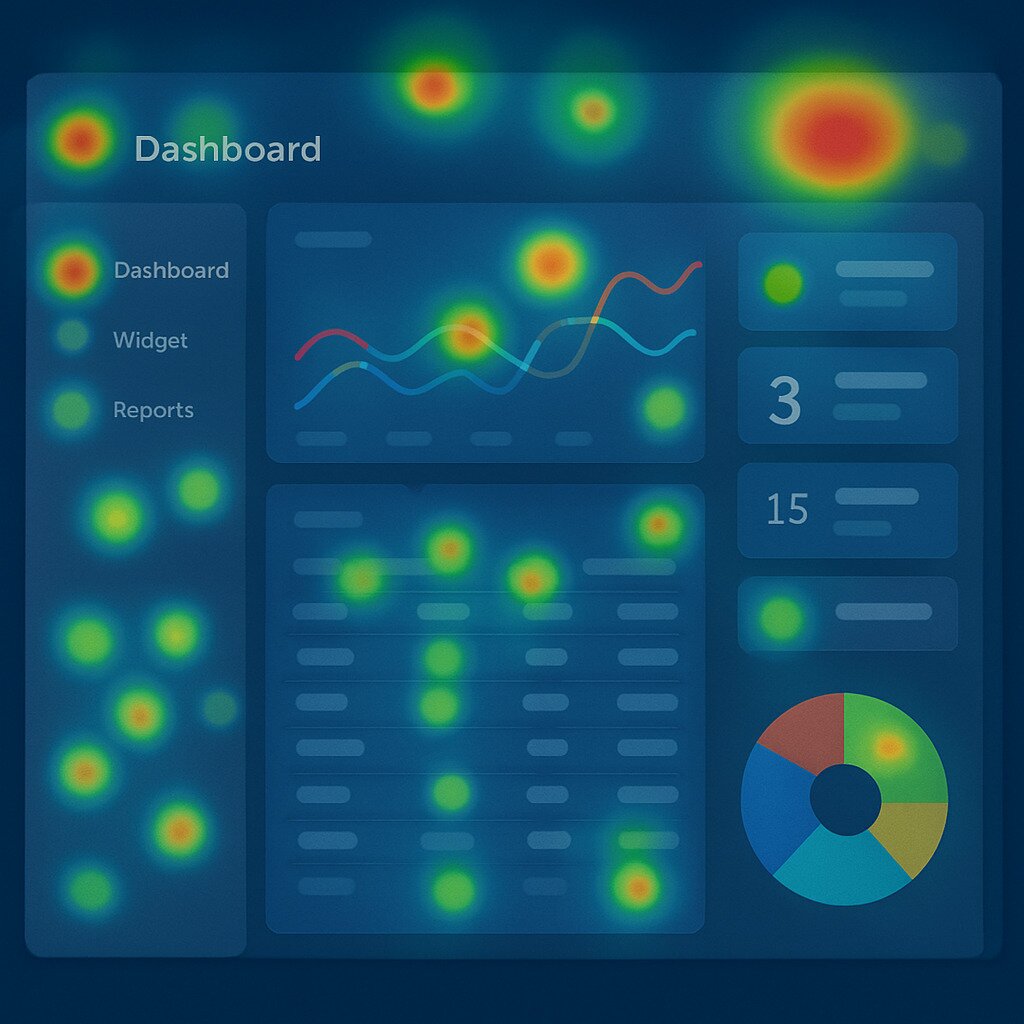
- Heatmaps and session recordings were employed to visualize where users spent the most time and how they interacted with key dashboard elements.
- Our team also tracked the average time spent on different pages and the bounce rate between pages, which helped identify friction points in the user flow.
Outcome:
- Based on these in-depth insights, our team made targeted improvements to the dashboard, such as clarifying navigation and improving call-to-action buttons to guide users more smoothly through their journey.
- Introduced tooltips and interactive guides to help users understand complex data visualizations and encourage deeper engagement.
- Iteratively improved dashboard filters based on how users interacted with them, making them more intuitive and flexible.
By tracking these in-depth interactions, we were able to better understand user behavior, uncover hidden pain points, and continuously improve the product to deliver a more seamless and effective reporting experience.We soon realized that the most valuable insights didn’t always come from our design sessions—they came from the users who had already found creative ways to work with our platform.
The biggest surprise: Admins were already solving reporting gaps
What surprised us most? Enterprise admins weren’t waiting for us—they had already built their own reporting workarounds. Many were manually exporting data, blending it with internal logs, and using tools like Excel or Tableau to track license usage, adoption, and collaboration trends.
At first, this felt like a failure on our part. But we soon realized it was actually a goldmine. These solutions revealed unmet needs and became the blueprint for our roadmap. From tracking inactive licenses to tying usage spikes to onboarding campaigns, admins showed us what mattered most.
Even better, once we included them in our design process, they became champions of the new dashboards—driving adoption, giving feedback, and helping us shape features that scaled across the org. Their early workarounds weren’t just stopgaps—they were a signal we were finally ready to meet.
What started as a surprise became a pivotal learning moment that reshaped our product strategy and strengthened our collaboration with enterprise admins. As we refined our self-service solutions, we realized that safeguarding data access and ensuring compliance would be the next critical focus.
Step 5: Ensure data privacy and compliance
The challenge:
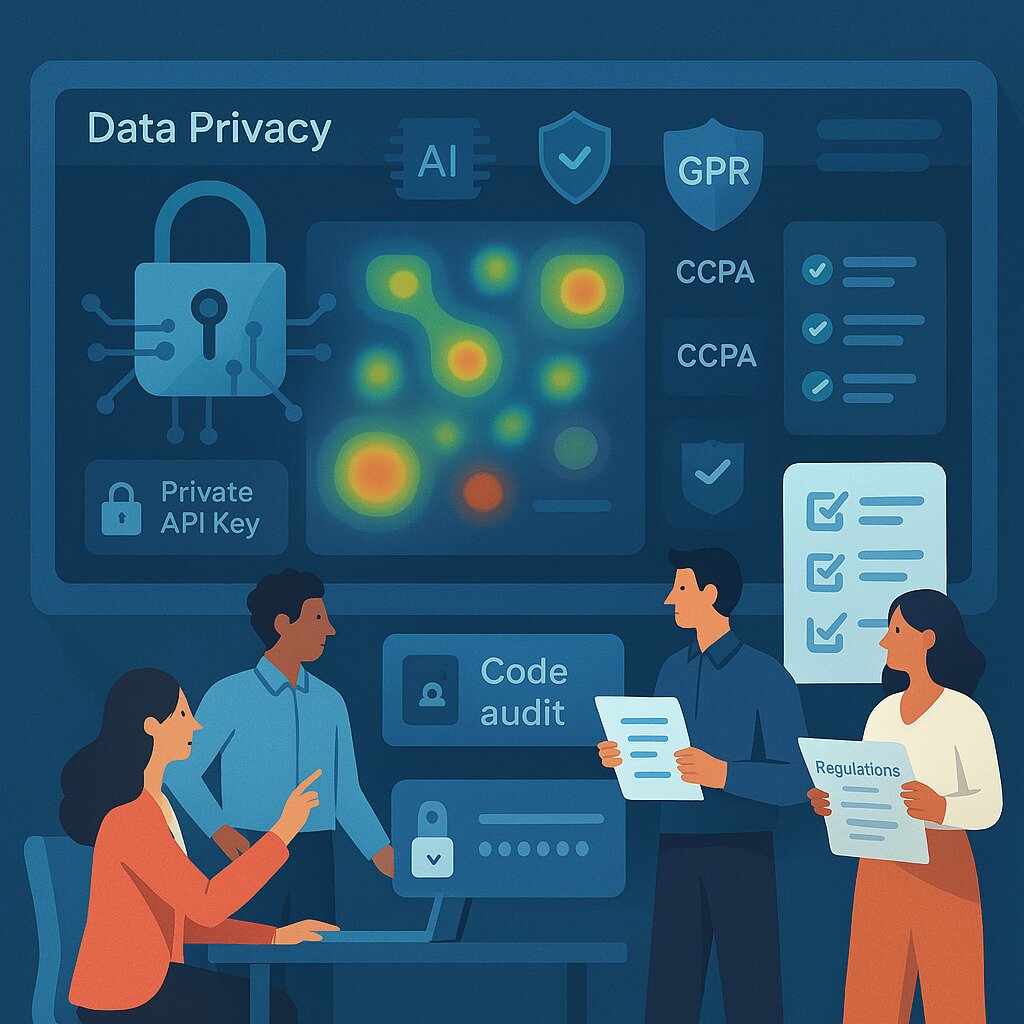
As our team expanded self-service options and introduced API access for real-time data retrieval, ensuring the security and compliance of customer data became a critical priority. Navigating complex regulatory requirements, such as GDPR (General Data Protection Regulation) and CCPA (California Consumer Privacy Act), while safeguarding sensitive information, was essential. Balancing convenience with security was key to maintaining customer trust and meeting compliance standards.
The solution:
Under my leadership, our team worked closely with legal and data privacy teams to ensure that all features were aligned with global data protection regulations, particularly GDPR and CCPA. Our approach focused on transparency and user control, while implementing technical safeguards to secure data. We communicated these measures proactively to our customers, offering clarity about how their data was being handled and reinforcing our commitment to privacy and security.
Actions taken:
- Technical code quality audits: Our engineering team performed regular technical code quality audits to ensure that our systems were secure and adhered to best practices in data handling. These audits identified any vulnerabilities and allowed us to mitigate risks before they could impact our customers.
- Customer control over data access: Our team empowered customers with control over their data exposure by providing clear, transparent communication on what data could be accessed. This approach ensured customers felt confident and secure in how their data was being handled and allowed them to make informed decisions about their data access.
- Private API key encryption: To safeguard data in transit, our team implemented private API key encryption, ensuring that sensitive customer data was protected when accessed via APIs. This method provided an added layer of security by ensuring only authorized requests could retrieve customer data, reducing the risk of unauthorized access.
Outcome:
- Increased customer trust: Customers were reassured that their data was being handled with the utmost care, in compliance with GDPR and CCPA. This led to improved relationships and higher customer satisfaction.
- Improved compliance readiness: Our regular audits and robust security features ensured that we stayed compliant with the evolving landscape of global regulations, making it easier to respond to audits and mitigate risks.
- Reduced security risks: By encrypting API access, limiting data exposure, and continuously testing our security systems, we reduced the risk of data breaches and protected sensitive customer information.
- Enhanced reputation: By prioritizing data security and transparency, we reinforced our reputation as a trusted partner for secure and compliant data access.
- Stronger legal protections: By aligning with global data protection laws, we minimized the potential for legal action and associated penalties, protecting both our customers and the organization.
Future considerations: Potential AI enhancements we envisioned
Looking back, our team under my leadership envisioned future potential to further optimize our self-service reporting capabilities through AI-powered feedback analysis. Had we continued to develop this system, those advancements would have significantly enhanced our ability to understand and respond to user needs. Specifically, we considered:
- AI-driven session analysis:
- Utilizing AI to analyze user session recordings to automatically detect patterns and anomalies in user behavior, such as frustration points or areas of confusion.
- Natural language processing (NLP) for feedback:
- Employing NLP to analyze in-app feedback and support tickets related to the dashboards, providing insights into user sentiment and identifying specific areas for improvement.
- Automated summaries and anomaly detection:
- Evaluating the use of AI to automatically generate summaries of user session recordings, highlighting key interactions and potential issues.
- Exploring AI-powered anomaly detection to identify unusual usage patterns or performance issues.
These potential AI integrations would have allowed us to:
- Gain faster identification of user pain points and improvement opportunities.
- Enable more precise and data-driven iterations based on AI-generated insights.
By continually exploring and adopting innovative technologies like AI, we aimed to deliver an even more seamless and effective reporting experience for our users.
Key takeaways for product managers
Minimize custom report requests:
Empower customers with self-service reporting and API access to reduce dependency on internal teams.
Standardize and automate:
Standardize key metrics and automate reporting to create a single source of truth and improve efficiency.
Monitor and improve based on metrics:
Track how customers interact with your dashboards and use these insights to continuously improve the user experience.
Tailor data access to customer needs:
Recognize that real-time access may vary; some customers may need immediate insights, while others may require periodic updates.
Focus on scalability and compliance:
Build scalable systems and ensure compliance with global regulations like GDPR to enhance customer trust.
Conclusion
By following this step-by-step framework, we empowered a visual collaboration startup's customers to make data-driven decisions independently. The result was faster decision-making, increased customer trust, and a more efficient reporting system. For product managers in SaaS, the key takeaway is clear: prioritize self-service and automated reporting to meet the evolving needs of your customers. The future of enterprise reporting isn’t about custom reports—it’s about providing real-time insights at scale.
Discussion prompt
How has your organization tackled data access and reporting challenges? What strategies have worked best for you in reducing custom report requests and improving self-service capabilities?
Let’s discuss in the comments below! Your insights and experiences are valuable to the community, and sharing them can help us all find better ways to empower customers and drive data-driven decision-making.
Keep reading
How to turn data into product ‘sense’