When I joined Duplo in September 2024, our retention metrics looked deceptively healthy. DAU/MAU was climbing. Merchant churn was low. NPS was stable. On paper, everything suggested strong product-market fit, but revenue per merchant was shrinking. Transaction volume was erratic. And more merchants were quietly splitting their payments across multiple providers.
Something wasn't adding up.
Over the following weeks, an uncomfortable truth emerged: our most celebrated metrics were masking our biggest retention risks. Merchants categorized as "active" were processing as little as 10% of their payments through Duplo. Churn looked stable, but critical transactions were migrating elsewhere. Support tickets were rising not in volume, but in type, in ways our dashboards couldn't detect.
We needed a system that captured real retention, not vanity retention. So we built one.
How the project came together
This wasn't a top-down initiative. It started as a side thread, a small breakoff group from the broader product and data teams, running alongside our main roadmap. Getting buy-in from engineering and data was not straightforward; we had more pressing items in the queue. But the signal was too important to ignore.
We made it a quarter priority. Over those three months, the group, spanning product, engineering, data analysis, and customer success, dug through transaction-level data, interviewed merchants directly, and pressure-tested every assumption before committing to a metric.
What we arrived at was a four-metric retention system that finally told the truth about merchant health, and predicted churn before it hit revenue.
Metric 1: Depth of integration score (DIS) How deeply are we embedded in the merchant's workflow?
A merchant who plugs you into one workflow is not the same as a merchant who plugs you into ten. Traditional DAU/MAU treats them as identical. DIS doesn't.
DIS measures the number of workflows connected (invoicing, reconciliation, payouts, vendor payments, APIs), internal systems touched (ERP, POS, accounting software), automation components adopted, and custom configurations implemented.
A merchant with a DIS below 3 was 7.4× more likely to churn within 90 days. High-DIS merchants almost never left, because ripping us out would break their operations.
Beyond churn prediction, DIS surfaced where onboarding was failing, which integrations drove stickiness, and which merchants needed expansion support. We moved it into onboarding dashboards and set target scores per merchant category. Within one quarter, average integration depth increased measurably.
Metric 2: Transaction velocity ratio (TVR) Is usage accelerating, stable, or quietly declining?
Traditional retention metrics look at static snapshots. TVR shows direction and momentum.
TVR = Current 30-day volume ÷ Previous 30-day volume
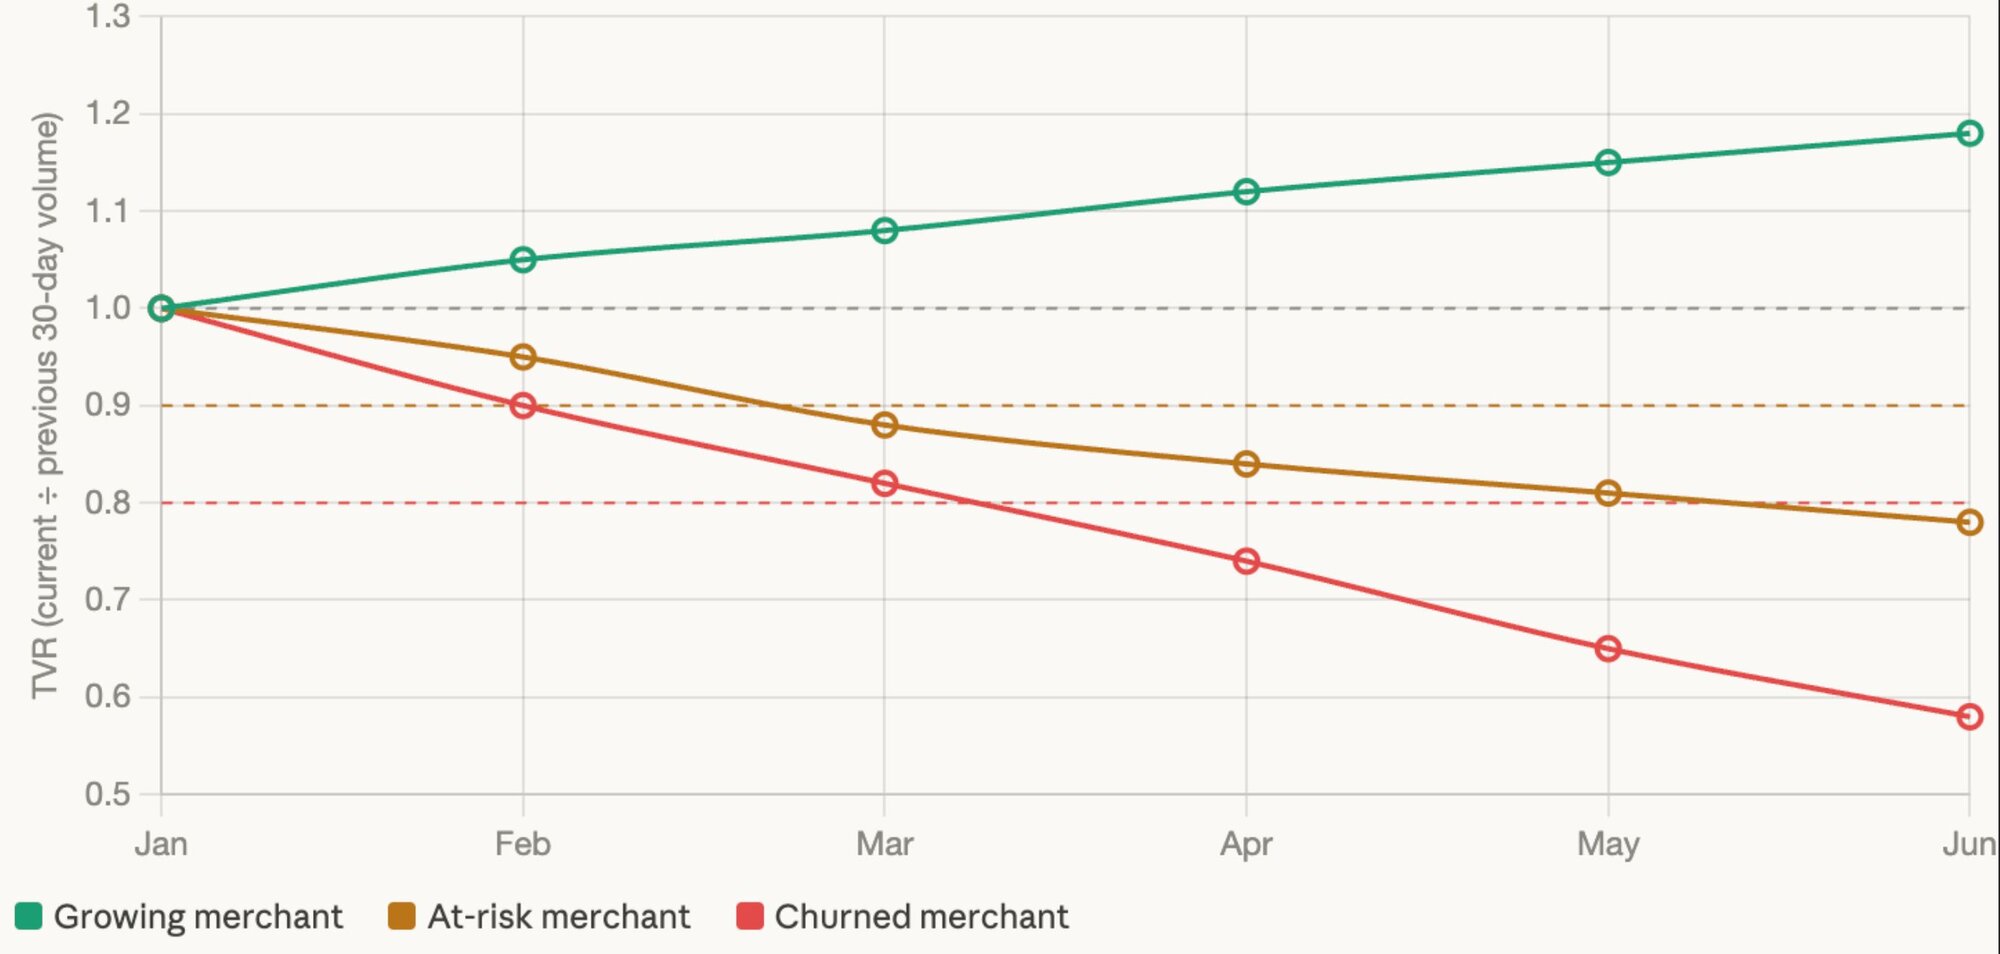
A TVR above 1.0 means usage is accelerating. Below 0.9 is an early warning. Below 0.7 is high-risk. Merchants whose TVR dropped below 0.85 for two consecutive cycles churned 67% of the time.
The insight is simple but easy to miss: churn doesn't begin when a customer leaves. It begins when usage slows.
We applied TVR to cohort dashboards, created automated alerts for yellow-zone (0.8–0.9) and red-zone (<0.8) merchants, and routed them to customer success immediately. Retention improved 35% in the following 60 days.
Metric 3: Support signal index (SSI) What are support tickets actually telling us?
Merchants who churned rarely opened more tickets. They opened different types of tickets.
Repeated "how do I…?" questions signalled onboarding gaps. Complaints about reconciliation delays showed trust erosion. Questions about alternatives meant the merchant was already researching. Sudden silence after sustained frustration meant disengagement.
The SSI scores merchants weekly based on ticket type, frequency, sentiment, time-to-resolution, clustering patterns, and drop-off in engagement. Merchants with a rising SSI were 3× more likely to reduce monthly volume.
Product and customer success reviewed SSI together weekly. Support-driven saves increased 32% within two review cycles.
Metric 4: Competitive displacement rate (CDR) Are we becoming their primary provider or their backup?
This one changed how we thought about the problem entirely.
A merchant doesn't churn when they leave you. They churn the moment they replace you, transaction by transaction.
CDR measures the percentage of total transactions we process versus competitors, whether we dominate the high-value workflows, and whether we are primary, secondary, or tertiary in the merchant's stack.
If a merchant processed 70% of payouts, 90% of vendor payments, but only 20% of collections through Duplo, that last number was a retention opportunity, not a risk. But when high-volume merchants dropped below 40% share overall, churn became likely.
We segmented merchants into CDR bands and built targeted retention plays for each. Within 90 days, high-CDR merchants increased wallet share by 14%, medium-CDR by 9%, and low-CDR merchants stabilised instead of declining.

The dashboard that changed everything
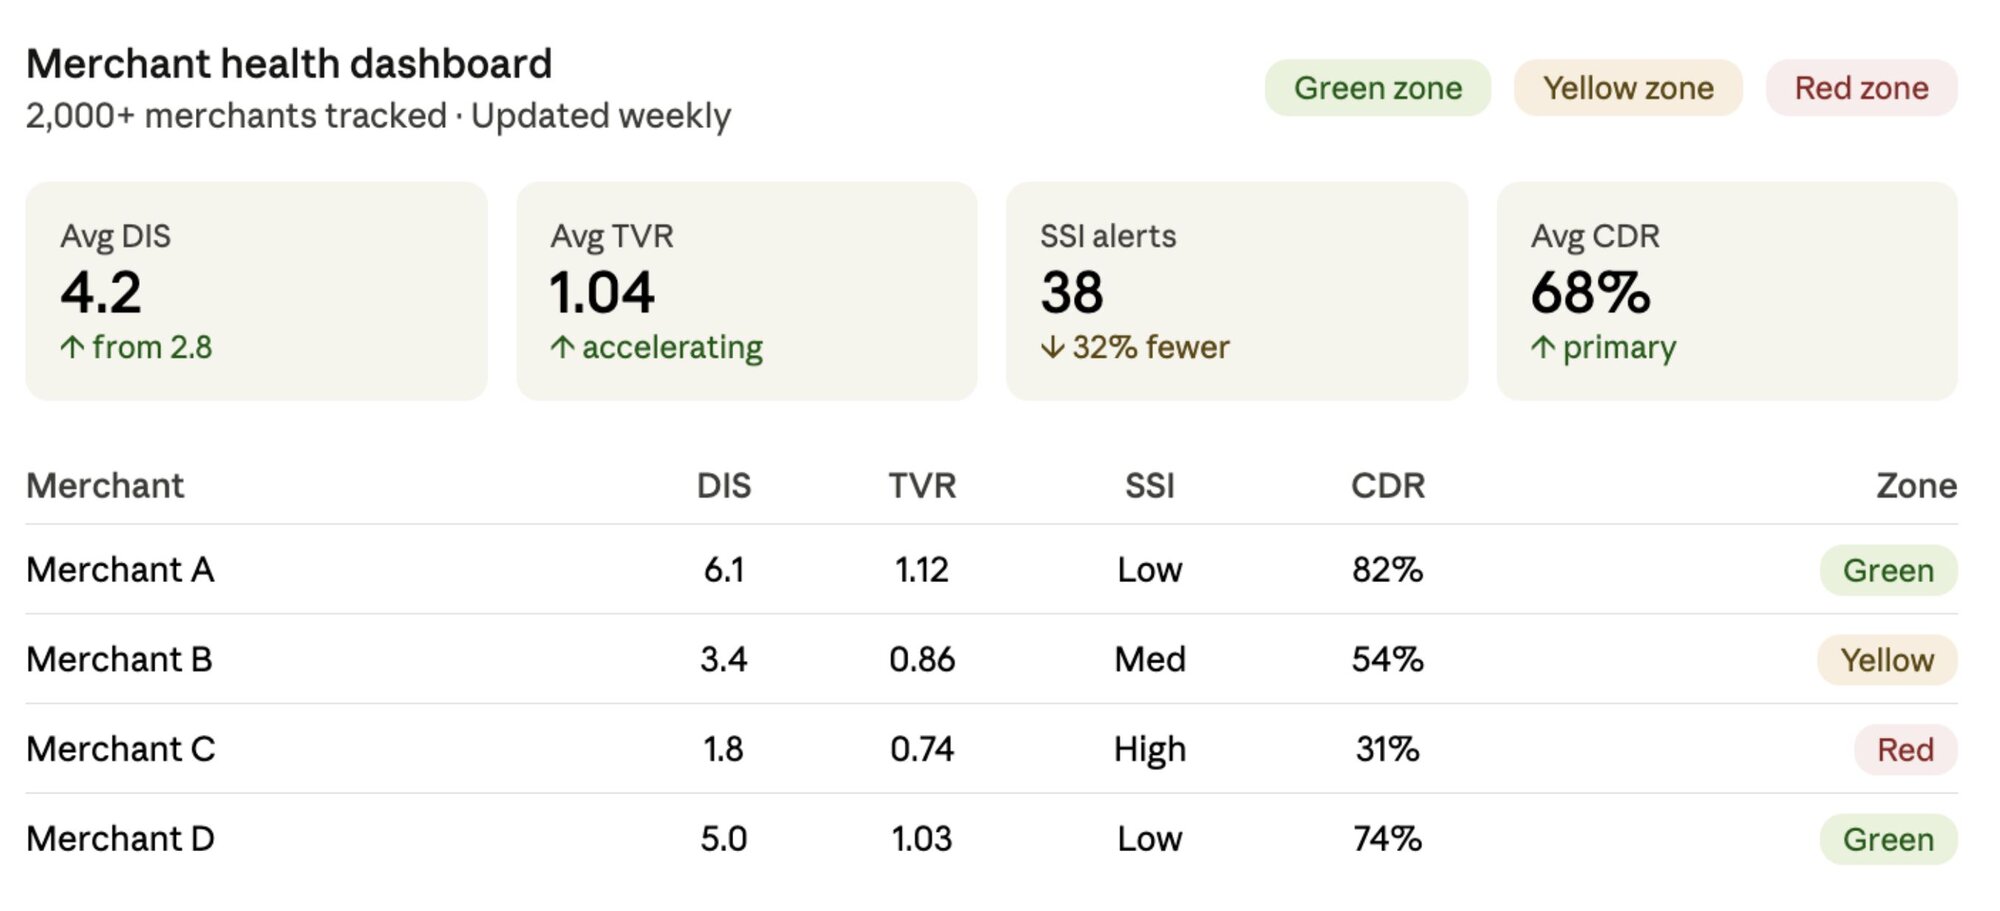
After defining the metrics, we consolidated them into a single executive dashboard showing a composite Merchant Health Score, cohort-level trends, risk zones (green/yellow/red), and recommended interventions for product or customer success.
This replaced our DAU/MAU churn tracking entirely. Leadership had a predictive view of health for the first time. Product teams had signals tied to real workflows. Customer success knew exactly where to step in.
Merchant retention improved 25% quarter-over-quarter, driven not by new features, but by better visibility into the right signals.
These metrics have become the backbone of every retention conversation at Duplo:
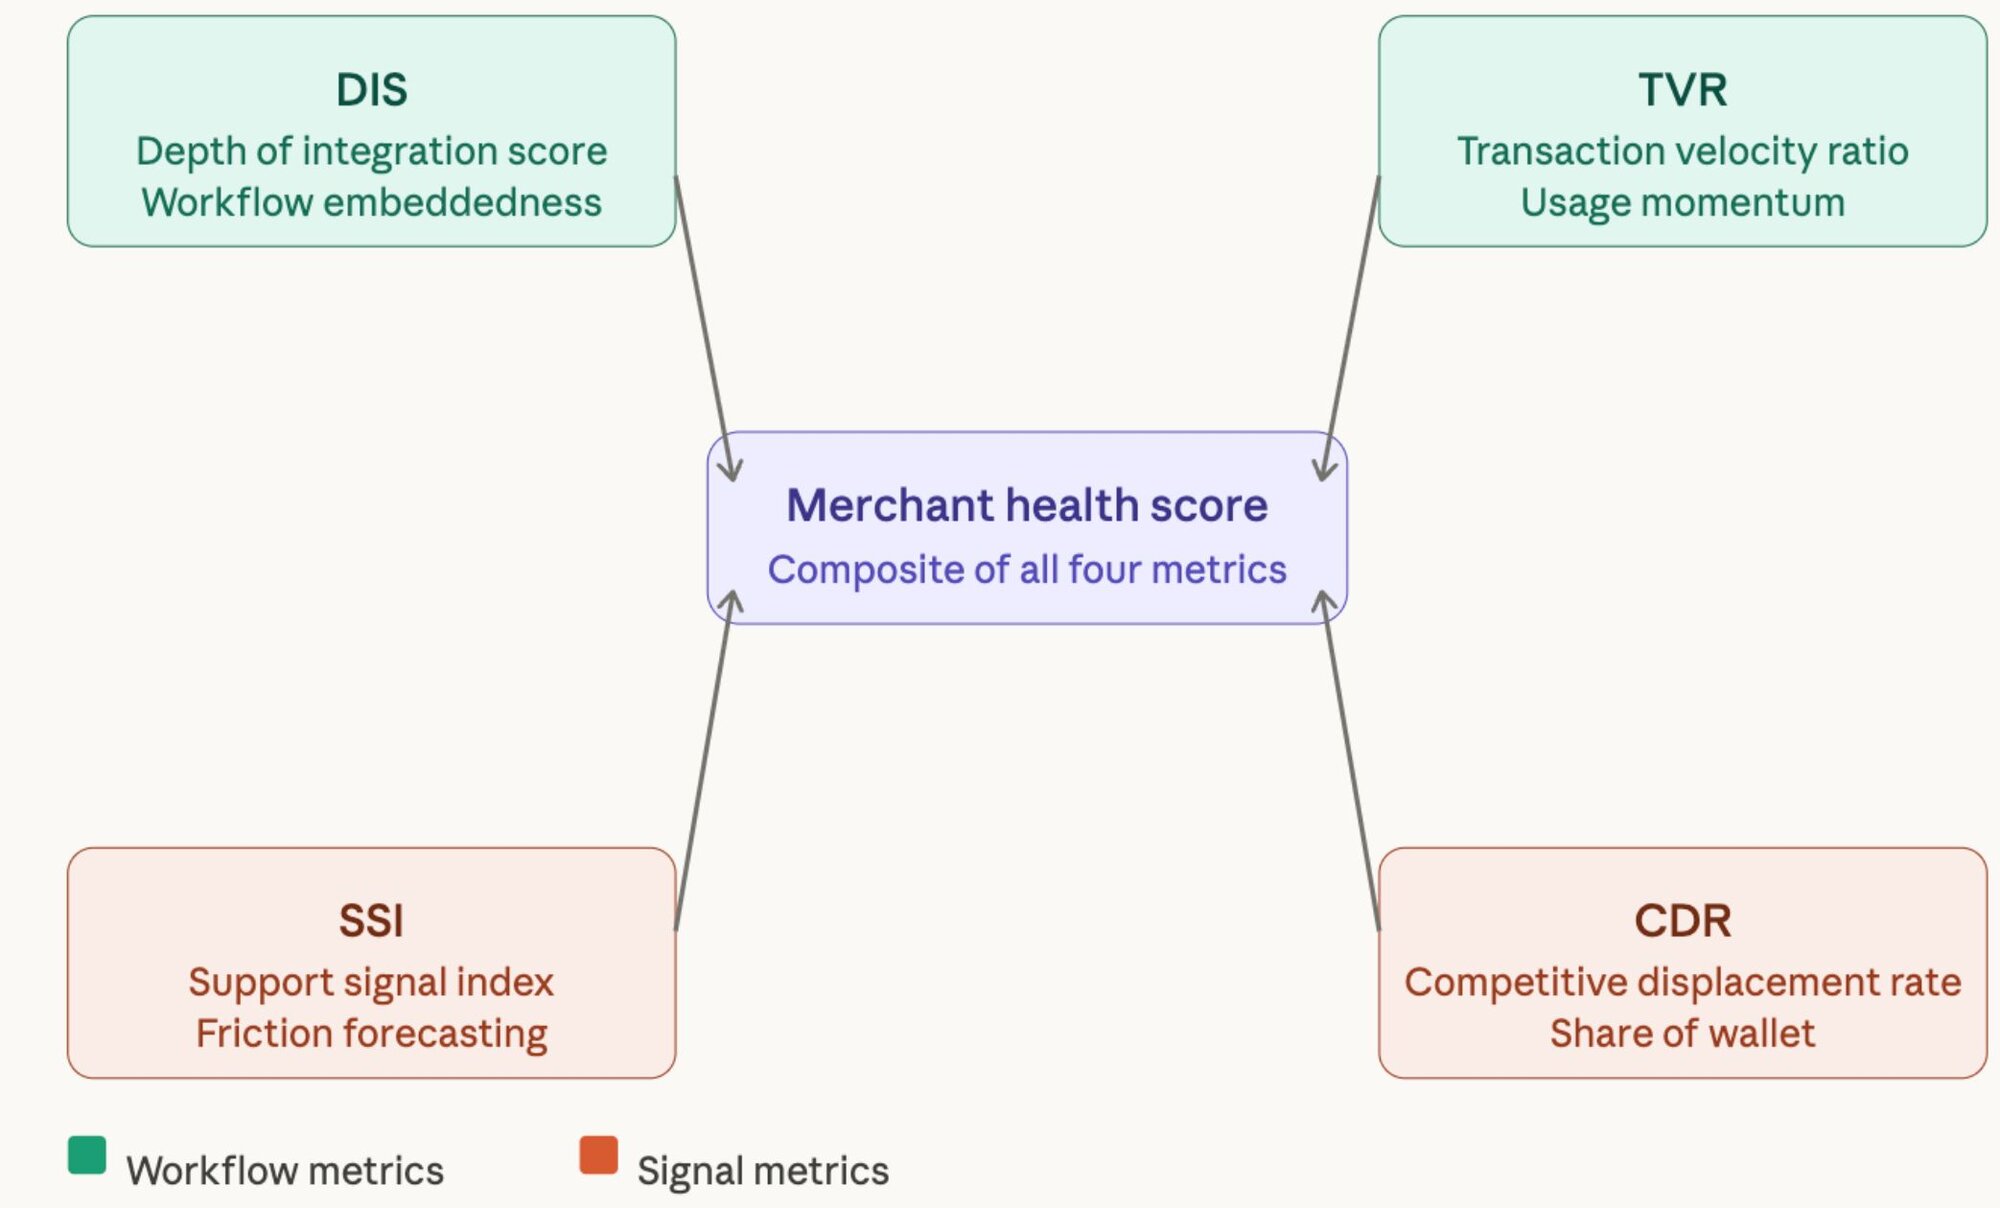
Do we touch critical workflows? → DIS Is usage trending up or down? → TVR Are support patterns signalling risk? → SSI Are we becoming their primary provider? → CDR
Together, they form a leading indicator system applicable to any B2B fintech or SaaS platform. The model isn't Duplo-specific, it's built on a principle that scales: measure commitment, not just activity.
Where this goes next
The four-metric system we built this quarter is a foundation, not a ceiling. The next phase is predictive, using the composite health score to model churn probability at the merchant level, and automating intervention triggers across customer success, product, and growth. We're also exploring how DIS and CDR together can inform expansion plays, identifying which merchants are structurally ready to adopt additional Duplo products.
The broader lesson for PMs building in fintech: vanity metrics don't just obscure the truth, they give leadership false confidence at exactly the moment when early action would have made the difference. The sooner your team can see past activity into commitment, the sooner retention becomes a proactive discipline rather than a reactive one.
Switching becomes unthinkable not because you lock merchants in, but because you've made yourself genuinely irreplaceable.