
In our previous post, we shared three stories of surprising user growth at Mail.Ru – the curious circumstances that led us to gain (or, in one case, lose!) users, how we discovered the root causes, and what we learned about our customers in the process. For the most part, those tales were about how we tried to change and improve the way users joined us, and the effects we created.
For our final three stories, we wanted to talk about changes that happened outside of our control – in most cases even outside of Mail.Ru – and the effects those changes had on our users’ behaviour. So, let’s jump right in!
The secret of the first day of the month
Let’s talk about the Calendar of Mail.Ru, which is the main productivity tool for our users. As product managers we are used to looking at real-time dashboards tracking the most important product numbers, and one day (specifically September 1st) we opened the dashboard and instantly saw something weird. The number of users who had come to the calendar by the middle of the day had reached the usual average number for the whole day – and then continued growing! By the end of the day it had doubled the usual number.

Our first instinct was to check the channels that drive users to the service. Typically our users come to the calendar by clicking a small calendar icon on the homepage of Mail.Ru, or on the navigation bar inside the email web interface. These are the two main channels for the project, and both of them showed this huge increase in the number of visits, while other sources showed no noticeable change at all. The team responsible for the homepage hadn’t delivered any changes to the page for the last few days, so what exactly was happening with those two channels on September 1st?
We wondered whether there were some marketing activities scheduled specifically on the 1st of September, but it turned out that there was nothing new launched. No new banners, no new ads – nothing that could result in such a change in traffic.
“Well,” we thought, “Let’s just chalk this up to a strange new user behaviour. Maybe they all returned from their vacation breaks and decided to get back to planning their working activities.” It sounded weird, but we had nothing better.
The next day we saw a similar increase. September 3rd and 4th – a much smaller rise. The 5th – no change at all compared to the usual traffic. “Well, that was weird, but it’s over,” we thought. And we were wrong.
Twice is Coincidence, Three times…
A month passed, and the same drastic increase happened at the start of October. And again, no change in marketing activities, email behaviour or homepage interface. November showed some increase, but it was two times smaller due to Russian national holidays. So we just waited for the December – and yes, here is this peak again:

So on the 1st of December we just opened the Mail.Ru homepage and stared at it in order to understand – why do people tend to click the Calendar button more often on this day? And suddenly we felt the urge to click it. But why?
Classical conditioning
It turned out that the homepage team had changed the way they present the Calendar button, but it wasn’t done on September 1th, but rather several weeks earlier in the middle of August.
Specifically, the team made a slight change and added the current date as a dynamically updating number on the button on both the homepage and inside the mail web interface. So people that opened the homepage or the mail interface on the first day of a month saw a button with a “1” inside. What does it mean? That’s obvious – that means there is a notification inside the calendar app, right? And that’s why they clicked the button, and that’s why the number of users increased that day, every month, and then tailed off as users slowly realised what was happening.


Did the team predict this dramatic change in users’ behaviour when they changed the button? Of course not – they just added it as a small refinement. And it showed the unexpected results several weeks after the date we launched the new views for the buttons.
What we learned
Some changes are unexpected and delayed, and sometimes the only way you can understand the impact of changes is to be empathic with your users, and just try to behave like one of them. That also means that you can’t blame everything on yours users being weird! Sometimes strange behaviours occur very unexpectedly and long after the actual change you made to your product. Try to build a strong rapport with your users, and be a lot closer to understanding what’s behind the unusual behavior.
When everybody is a financial analyst
Informing people about what is going on in the world and in their region is one of the mai purposes of Mail.Ru’s homepage (as you may recall from our first story, people really care about the latest sports news!) For that reason there is exchange rate information for the conversion of dollars and euros to rubles. This information block usually has a low but stable CTR value, and we’ve kept it on the homepage mostly for information purposes (and inertia), than for navigation to extended data.
To be honest, we have had several discussions around whether we should keep the currency block, or whether it is redundant, and it’s time to remove it from the homepage. But suddenly, our users’ behaviour changed.
The economic situation is currently harsh in many countries; stock exchanges’ indexes falling rapidly and everybody is feeling a bit stressed about their finances. The situation became more complicated a little over a year ago: the exchange rates of dollars and euros to rubles dropped twice, oil prices went down. It was like everybody became a financial analyst in overnight: people talked about the future of our economy, oil price trends and currencies’ exchange rates. They made forecasts and gave advices on how to save money. Suddenly they became interested in real-time information about exchange rates and oil price.
That is one of the reasons why we love our job. Out of nowhere, we had an opportunity to deliver another much-requested feature!
The data must flow
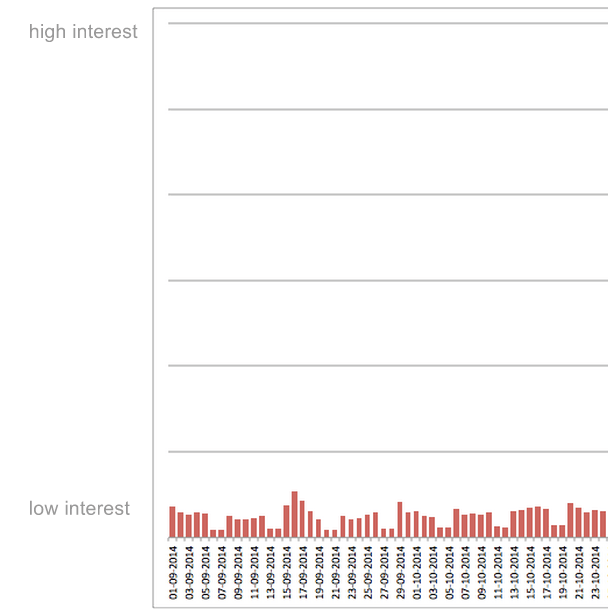
While we saw a huge surge interest in economic and financial news, the currency info’s CTR also increased significantly. Until that moment we had showed official exchange rates, published once a day in the mornings, and that was basically because the actual rates didn’t generally differ from the official ones.
But now people wanted to see the actual exchange rates, not the outdated ones coming from the Central Bank. Most people don’t even know the exact difference between them, but because all news talks were about current rates and not official ones, our currency data suddenly became irrelevant.
We had several things to do: first of all we switched our data source from the Central Bank to the Moscow Exchange, meaning that people stopped doubting the exchange rates on our homepage. We also changed the currency exchange rates block to use ajax updates, so our users could meditate while watching it fluctuating from 80 rubles per euro to 100 rubles and back.
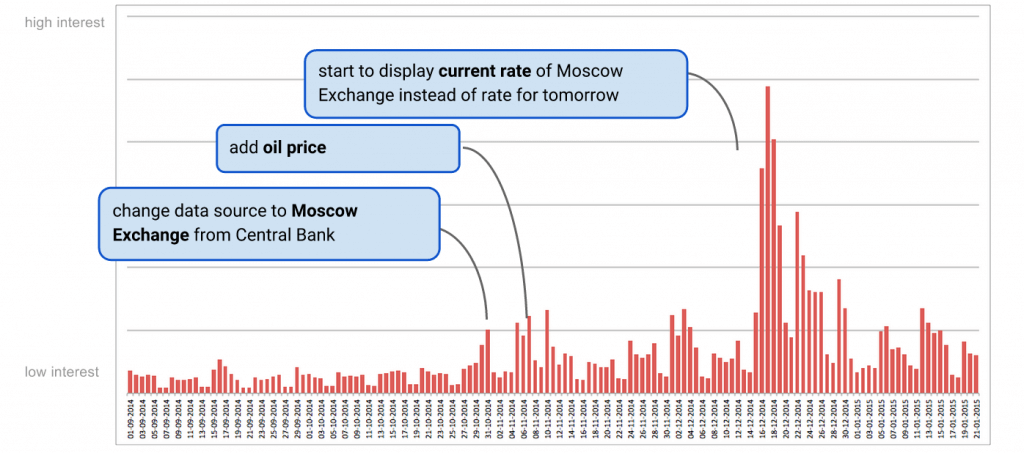
The second trending topic was oil prices. Nobody had cared about that for years, but now everyone had realised that there are several oil brands, and even that there are forecasted prices and production value. Given that our mission is to help people find relevant information without searching through many difficult professional sources, while we were working on the data connection for our exchange rates, we naturally added oil prices to the homepage.
Although the interest in this data had spiked, it ultimately returned to normal. However,the changes we made at the time now allows the homepage to have almost any kind of fresh content that is relevant to user’s interests.
What we learned
The lesson we took from this episode is possibly obvious: Use statistics not only to measure how product features perform, but also to notice what is trending now. When you find a trend, quickly decide if it might be an opportunity, and adjust the product (or not) accordingly. And don’t underestimate the value of having an excuse to invest in your infrastructure!
What do people do if they can't access their services?
As we know, most of really popular and big internet services usually work just fine. But even they sometimes have technical problems and people can't access them. So what do you think people do when really huge internet services have technical problems?
Our statitics show what’s trending (and what’s bothering people) right now, because Mail.Ru`s homepage is a kind of social thermometer. We also get to see immediately how people react to problems on our site and around the web, and it looks amazing.
If there is a problem with another search service, the number of search requests on our homepage increases immediately – no surprises there. Even the audience size increases, because there are new users that come for our search features, and it turns out that audiences flow easily between search services.
If there is a problem with another social network, the impact is amazing – It’s like panic, with people fleeing in all directions. They are going to our email service, making more search requests (probably searching for status messages), download our browser (maybe because it’s integrated with social networks), download ICQ, and they even read more news. We think the last one is some kind of procrastination.
Curiously, if there is a problem with another email service there is no significant increase in the number of people using our or news, or even search features. While the overall usage of our email service does increase, the total number of new user registrations does. It turns out that when people want to use email, they are actually very focused on a specific task. In addition, they’re either very slow to change email providers or they have email accounts with multiple providers for redundancy
What we learned
All sorts of changes or problems in the rest of the world, or other products and services, can influence your product – especially if your product is a web-based service (obviously). Good analytics and dashboards can help to recognise what those impacts are, what the underlying triggers are and maybe even let you help a disappointed user & gain a new customer! This is easier when you have a huge user-base (and therefore enough data to give you significant results), but a clear understanding of your users’ “normal” behaviour is the most important thing.
Conclusion
While our stories are purely based on our experiences from Mail.Ru, and the challenges and opportunities of having a huge, web-based product, there are lessons where which we think everyone can use.
First of all, users will behave in ways you don’t anticipate. This is to be expected, and all you can do is try your hardest to build a rich understanding of them, and test your theories before you make expensive commitments!
Second of all, data trumps theory. One of the things we have a lot of at Mail.Ru is data, courtesy of a huge user-base. Our challenge – and one that we should all be aware of – is how to pick the relevant bits of data and make sense of it.
Thirdly, once you’ve committed to deeply understanding your users, and you have access to good data about how they’re using your product, be ready for unexpected opportunities! If you spot something that looks promising, test that it’s a real opportunity, and then be ready to commit more of your resources if it looks like your users love what you’re doing.
And finally, even as you’re testing and building your product, always look for opportunities to improve the back end of your product or product manufacture process while accomodating new market demands – a little low-risk investment can go a long way!
As we said before:
Be open to real data, real user behavior and external events. Be ready to change your product to react to users’ new expectations, but also be open to the possibility of you being wrong. Don’t forget to double check your decisions, and be ready to test anything and everything possible. New real-life knowledge about your users will always result in a better product.