In part 3 of this series analysing the results of our product manager survey, we'll be looking at the breakdown of responses from people based in the US. (Part 1 is here and Part 2 is here.)
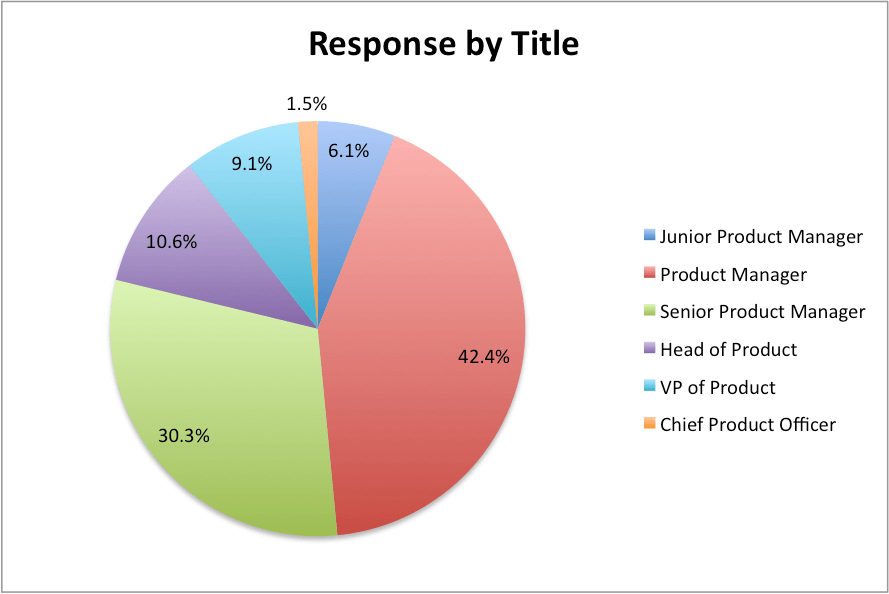
In the survey 23% of the responses came from the US. Of these responses, 42% came from product managers and 30% from senior product managers. It will be hard to draw many conclusions from the data, but it is still interesting to look at.
How do we work?
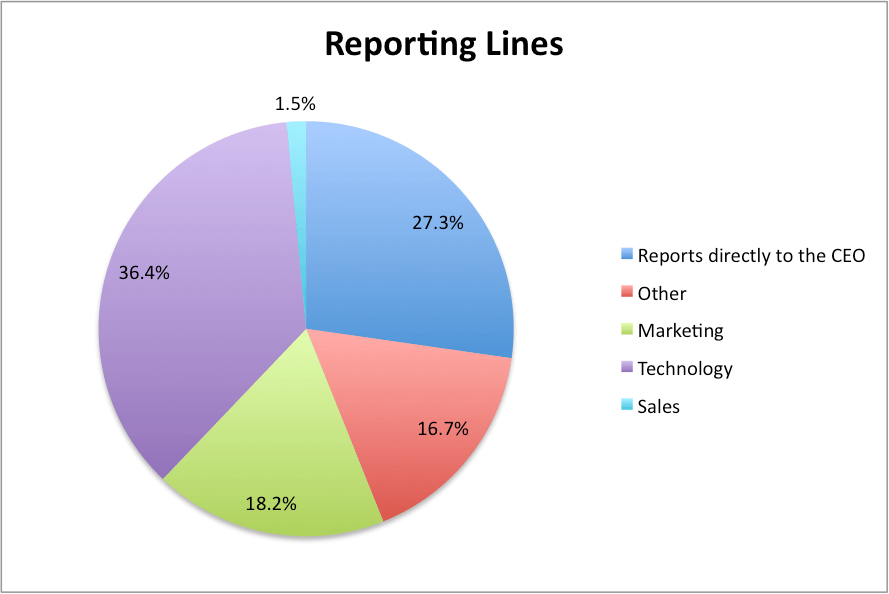
Some 36% of US-based product managers report into technology, with 27% reporting to the CEO. In contrast, the UK has more people reporting to the CEO, followed by technology. This is somewhat surprising as I expected the US to have a similarly greater percentage of product managers reporting into the CEO. Like the UK there is significant percentage of respondents reporting to 'other'. I'm curious as to what the 'other' is.
The average product management experience in the US is 6 years, compared to the UK with 4.4 years. This may simply be due to having more senior product managers responding from the US. However, it does follow the trend of the US having a stronger history of product management than the UK and Europe.
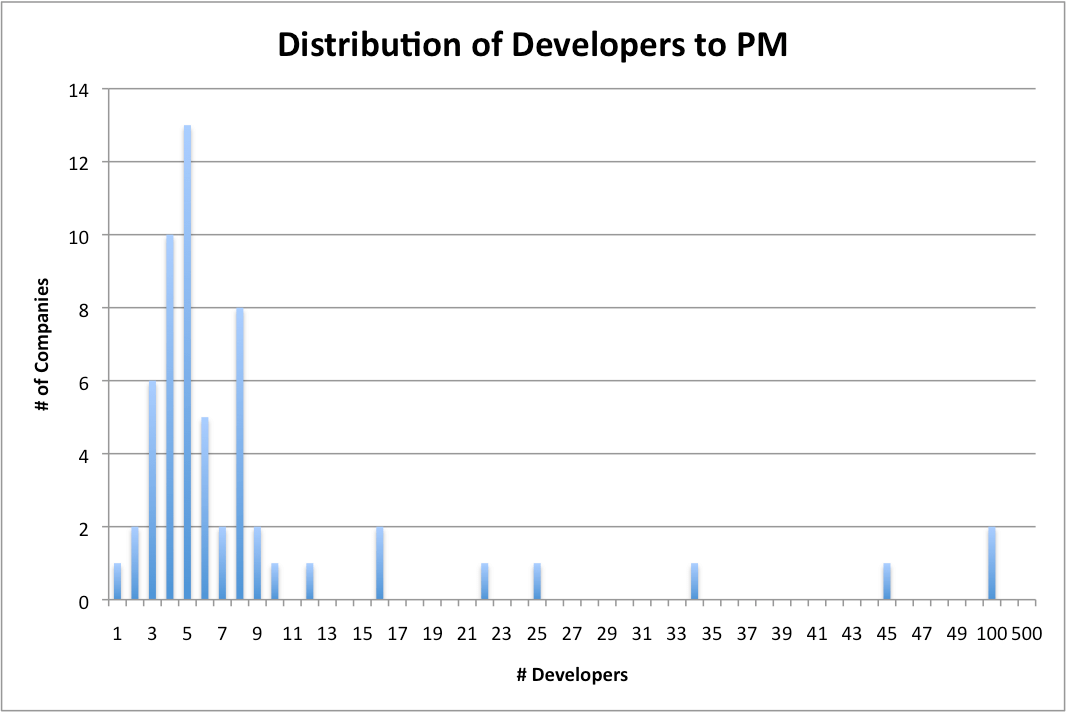
The median number of developers to product managers was five for the US and the distribution was much stronger around the five and six ratio than in the UK. Again, this is not really surprising as the US has had longer to arrive at the 'best' ratio than the UK.
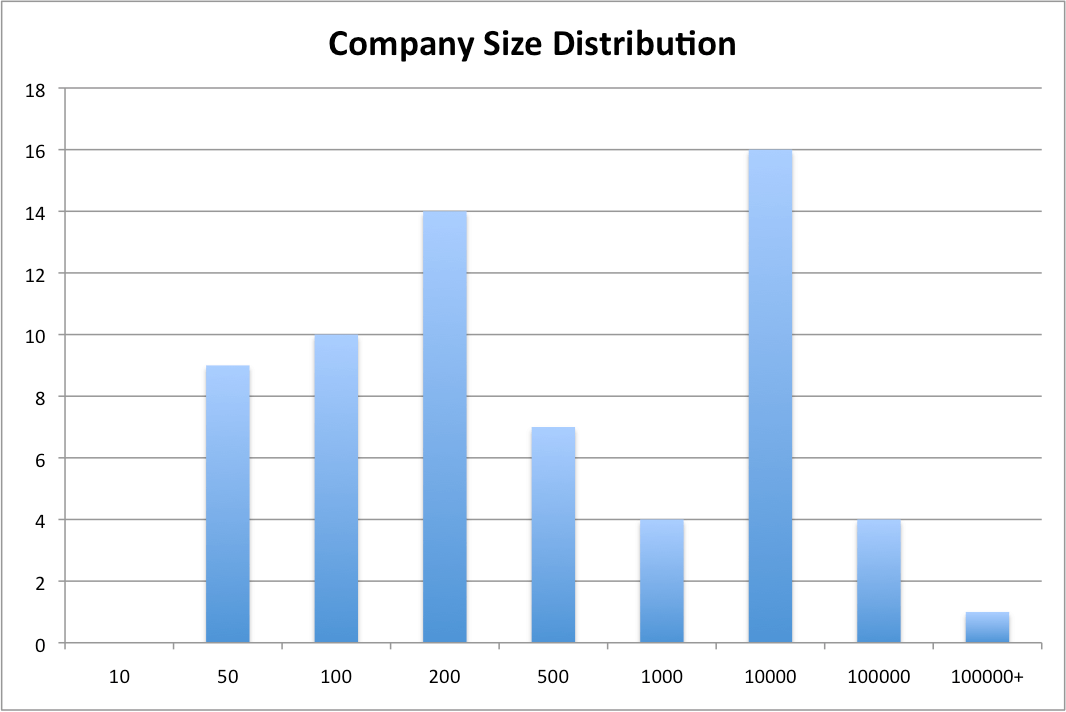
The mean size of company for the respondents is 200 employees for the US (larger than the UK at 150 and overall at 185). The distribution shows the the respondents are concentrated in larger companies than those from the UK. This, I think, reflects that we are weighted towards the larger companies in the US, whereas in the UK we draw across the board to a greater extent.
What are we paid?
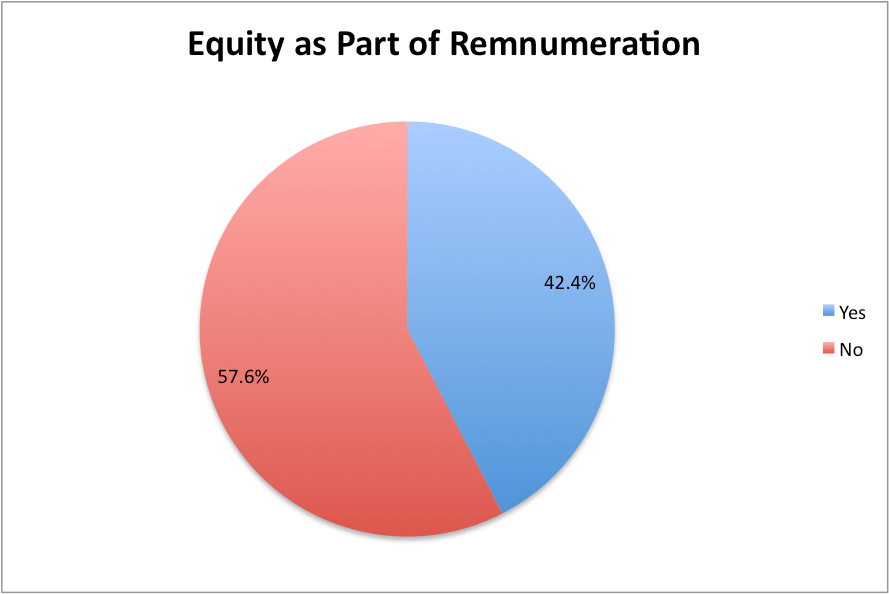
Perhaps the most interesting part for comparison is of course the salaries. All the US salaries where converted into GBP using exchange rates for December 2012. The US product managers had a greater percentage, 42%, receiving equity as part of their compensation, versus the UK which has 35%.
Interestingly, there is significant salary differential between senior product managers and heads of product in the US (approximately £20,000). While it is difficult to draw any firm conclusions from this data, it does indicate that the head of product is considered a distinct title between senior product manager and VP of product. Assuming the UK and Europe follows the US, then this is likely to see the head of product become more distinguished from a senior product manager than it currently is.
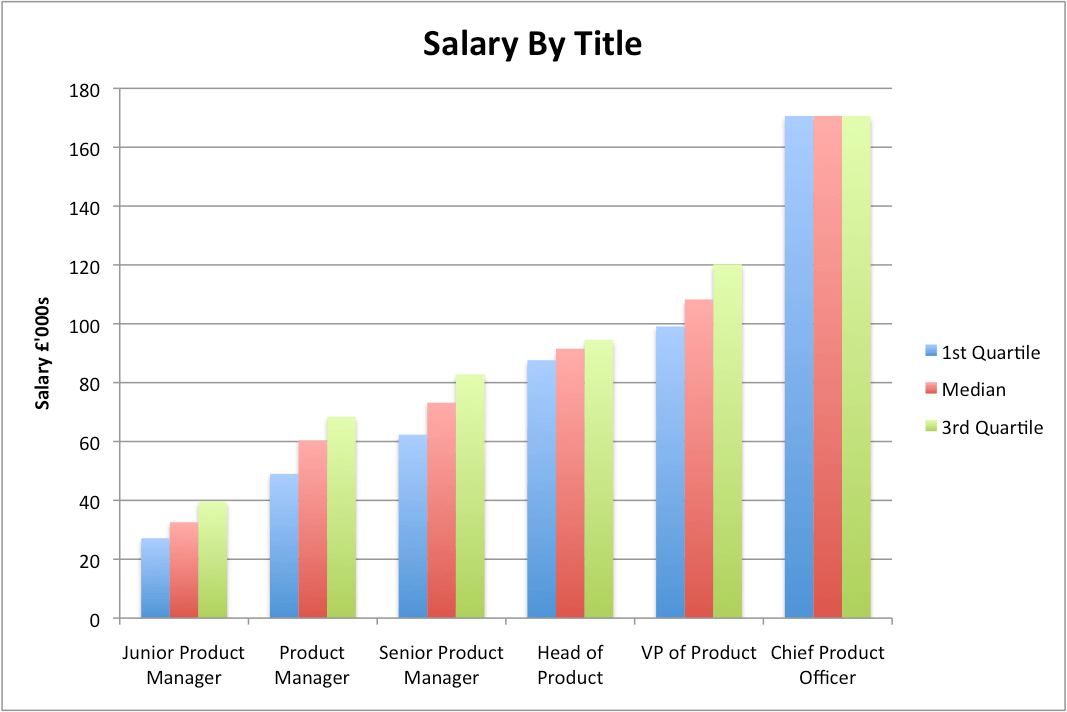
I would ignore the chief product officer (CPO) salary as we only had one respondent, so it is pretty impossible to draw any conclusions between VP of product and CPO. This isn't too surprising as the concept and title of CPO is still relatively new, even in the US.
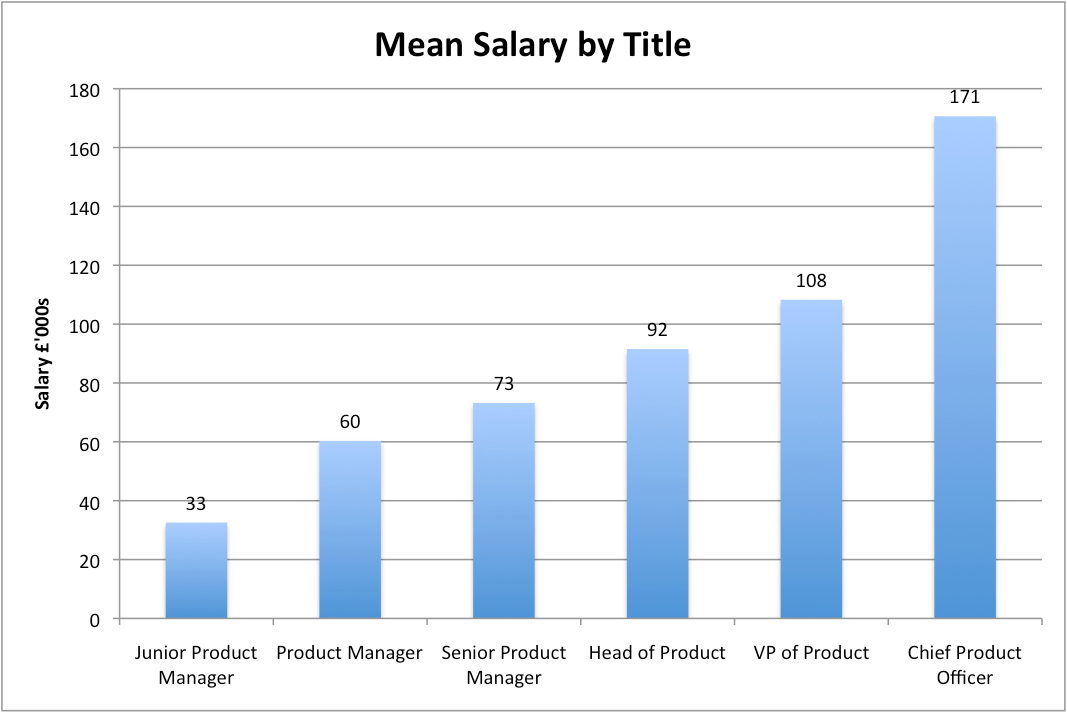
Another interesting comparison is the difference in mean salary for each of the titles between the US and UK. Ranging from £13,000 for senior product manager to almost £30,000 for the VP of product. Although, the position of junior product manager matches, I suspect given the lack of response for those positions and the significant jump between junior product manager and product manager that this is a property of the data rather than a trend.
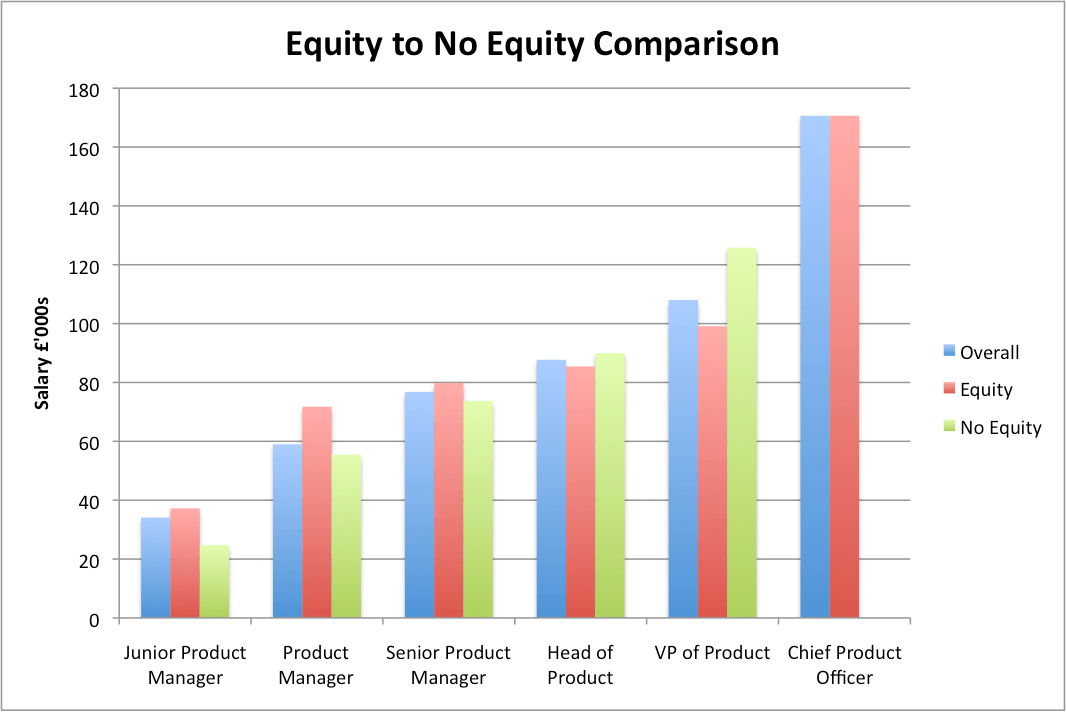
At the top end of the job titles, respondents with equity had a lower salary (as expected), but at the lower end had a higher salary when the respondent was a junior product manager, product manager or senior product manager. It is curious and I suspect it has something to do with the data rather than being a real trend.
Summary
This is the last in the series and the data has shown up some trends and anomalies. Several items do stick out:
- It will be interesting to see whether the UK and Europe follows the US in the differentiation between senior product manager and head of product.
- If you are a European company expect to have to pay more for your product managers over the coming years, particularly if you try to import them from the US.
- The salary differential is considerably different between the UK/Europe and the US than the raw numbers suggest as there has been no attempt to normalise for cost-of-living. Numbeo and Expatistan both suggest a cost of living on the order of 12% (New York) and 40% (Boston) with San Francisco in the middle. Or the actual purchasing power parity is an average 28% greater.
Hopefully, the next survey will include a larger sample from the UK, the US and all around the world so that firmer conclusions can be drawn.