
When Jake Walker joined Mailchimp as Director of Product Analytics in July 2019, he quickly set out to implement a user-friendly framework, measuring the overall product experience. In just six months, his framework was in place.
Here, he explains the steps he and his team took to implement this new initiative and what they'd do differently if they could do it all over again.
Overview
Mailchimp is an all-in-one marketing platform for small businesses known by many for its playful one-liners and the effort it applies to align with a customer's emotions at every point of their marketing campaign. If you're a Mailchimp customer who's ever had to hit send on a mass email, you'll hopefully appreciate the humour and personality behind the product experience.
I'm fairly fresh to the Mailchimp game. I've spent nearly all of my career working in marketing analytics for advertising agencies, I'm not a product person, but I was keen to move client-side and when the role of Director of Product Analytics at Mailchimp came up it seemed like the perfect fit. I saw it as an opportunity — and a challenge — to apply the skills I'd learned in a completely different way to product.
When I joined, the biggest problem to solve was how to tie the individual contributions of domains or squads, and their work on a particular portion of a product feature, back to business metrics and objectives (think big metrics like revenue and retention). In particular, product teams struggled to accurately represent their work to product leadership.
At the time, there was a North Star metric framework that had been implemented a year or so earlier, but wasn't having the desired effect. There were gaps in the data, and there needed to be clearer connection points from the overarching business goals to individual workstreams.
Very broad metrics were used as a benchmark for success for individual teams. It was a case of saying: "this thing generated this much money" or "that thing changed activation for the platform," but in reality, those metrics are the byproduct of a multitude of different activities—sometimes internal, sometimes external, and sometimes both factors combined.
My challenge was to draft and implement a new framework, as part of a bigger playbook, that would make those conversations completely different and ultimately lead to measurement autonomy across the organisation.
The Approach
I knew the framework I wanted to implement, but most of it was in my head. I've been slowly but surely tweaking it throughout the last few years, adding things I learned in different roles, adapting it with the feedback I'd received at previous agencies, and getting more comfortable with how to present it. The challenge was to extract that information and to communicate it to my new team so that we could draft it appropriately for the people in our organisation and gain alignment to alter the way things were currently being done.
I was keen to have it ready to use from the start of 2020 when everyone was considering their roadmap and plans for the year ahead. That meant moving very fast. I joined in July and kicked off the initiative in Q4, dedicating the entire quarter to the work.
Trying to push through change in an organisation of this size (over 1,200 employees, $700 million in revenue in 2019) would require a balanced team with different skill sets and perspectives. Within Mailchimp, Product Analytics and UX Research sit under the umbrella of Product Insights. I have a counterpart, who leads the UX Research team and we both report to the same person. Working on the framework with me were two people from my team, Product Analytics, and three from the UX Research team.
As the architect of the concept, I led the project, the UX Research team represented the qualitative side of the work, and my team represented the quantitative side.
Aligning on Language and Approach
I first needed the team to align on what the framework would actually look like and the language we'd use that would best resonate with our teams and leadership. I found the most effective way to do this was using a metaphor explained like this:
Imagine Mailchimp as a machine full of gears and levers, in which there are things you can control and things you can impact (the language we use to talk about lagging metrics).
There might be multiple things you control that will also impact something. But, there might be only one thing you control that has the ability to potentially impact another thing.
We broke this down into a very simple illustration:
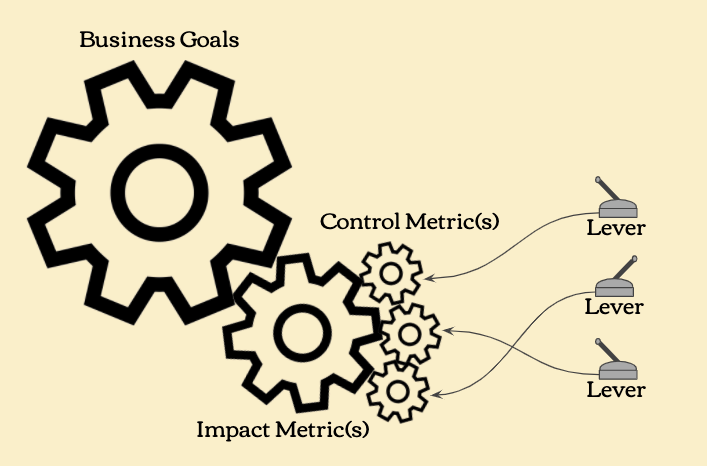
Here you have big gears, medium-sized gears, small gears, and levers:
- Big gears represent our Goals (our broader Business Goals and Domain/Initiative Goals)
- Medium gears are our Impact Metrics
- Small gears (our Control Metrics) are turned by the levers
- Levers represent the effort you put in and the things you do (e.g. release a feature)
As a Product team, you can pull the levers and move the small gears (your Control Metrics). It may be that it takes multiple small gears to move one medium-sized gear, which is a one Impact Metric.
Using this metaphor, anyone can describe (or visualise) what needs to happen in order to move those big gears. It also gives teams, and the organisation, the ability to more effectively triage where they need to optimise.
Important Iterations
The language, 'Impact and Control' was brand new for Mailchimp. In fact, even I'd been using a different language to describe it for many years previously.
Previous iterations had three layers of metrics. I'd referred to these as Primary, Secondary, and a third level, which was Diagnostic, but, through conversations with other clients, I'd found that it just didn't have the same sticking power which is important when you're trying to get people and organisations to adopt new language and nomenclature.
When working to make changes within a company, you have to use language that resonates and doesn’t add friction to what you’re trying to accomplish. If a “standard term” or buzzword causes skepticism or confusion, it's okay to find a different one that works. While “Primary and Secondary” may have been more standard, “Impact and Control” developed during the course of many conversations and it stuck because it's simple and very easy to understand.
Applying Customer-Centric Measurement
Over time, as the Mailchimp platform has evolved, how we think about measurement and our customers has changed. Through conversations and research, we realised that the stages of their user journey, and the reality of how our customers behave, is far more complex and messy than a linear measurement allows for, which was affecting how we talked about product success.
Linear: Acquire → Activate → Convert
= Sign Up –> Feature Adoption –> Become a Paying User
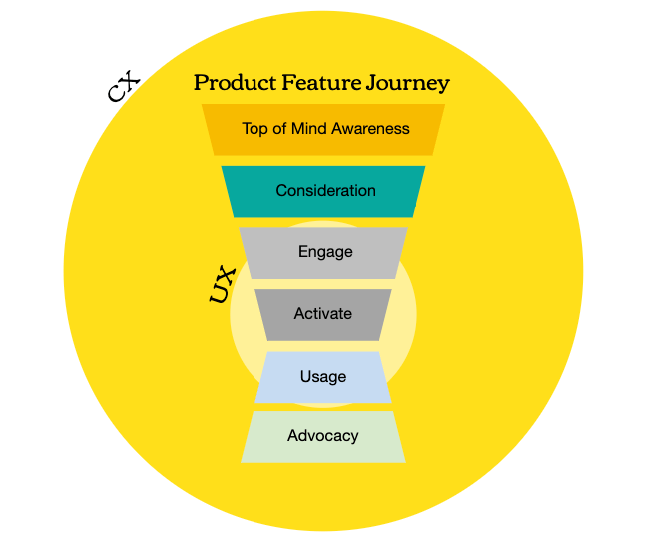
Instead, we changed the hierarchical structure of the metrics and the connection points, plotting the customer journey over six different stages: Awareness, Consideration, Engagement, Activation, Usage, and Advocacy.
Understanding our Audience
We also made the audience a more contextual layer splitting it into: Audience/Segment, Customer Journey and Desired Behaviour/Outcomes, because we knew that building for ‘all Mailchimp users’ would be too broad and would be difficult to measure the success of individual outcomes. We needed the framework to help the team narrow down specific user segments.
For example, on our Automations team, a goal is to drive more usage of our new Automations product. This product has two different groups of user:
- New Users (within their first 90 days)
- Existing Users
Each group has a completely different user journey.
For new users, the framework needed to be around what to track and measure to ensure that new users were aware of the product and able to get started. For existing users, those who've been using Automations for some time, the goal was to get them to switch over to the new product. For these two groups, some of the metrics are similar, while some are totally different, and so the team created two different frameworks.
Prior iterations of the framework made it seem as though you'd have to change the metrics every time you had a different audience, which is extremely cumbersome. Making this layer more contextual allowed for more flexibility and meant the audience could be represented as more of a lens through which you could look at performance and recognise success on a different scale.
Writing the Playbook
The first draft of our playbook, featuring the new framework, was a 20-page Google Doc, but, for the purpose of implementation, the content also needed to be sharable and easy to digest. We, therefore, created a second document in the form of a deck. This was to act as a companion guide – 20 slides rather than a 20-page, text-heavy document.
Building these documents took time. We worked in asynchronous workstreams where we'd all contribute, change, and comment on the content from different angles. We'd then come together in meetings to discuss and hammer out the finer details. One thing we were very strict about, however, was that there should be one consistent voice throughout, regardless of who contributed.
You often notice this in decks that have been worked on by multiple people—the language, tone, and structure all lack consistency. We wanted to be sure that this wasn't going to happen and so one person volunteered to write the complete first draft.
Implementation
Introducing the playbook and explaining the framework and how it would be applied across the organisation had to be done in person. It would have been impossible, not to mention ineffective, to roll it out by sending everyone a 20-page document and saying "use this now". It was something completely new for a lot of people.
Instead, we set up two, four-hour workshops in which members of my team walked other cross-functional members through the deck, step-by-step, covering:
- The pillars of our playbook: the measurement framework itself, Impact and Control metrics and benchmarks and targets
- Guidelines for choosing Impact and Control Metrics
- Tracking success with examples and templates to support teams in the creation of their own measurement frameworks
Below, you'll find an example of how the framework could be applied.
Creating a Framework for New Users
Let’s say a team building a unique recommendations feature wanted to create a framework to track and measure what they could impact and control within a new user's first 90 days. The goal here (the big gear) wouldn't be paid users or revenue—the customer is already paying. With the new framework, the team would need to determine the gears and levers they were responsible for that would help to drive the end result.
For the new user audience segment, they would plot the customer journey across the six different stages: Awareness → Consideration → Engagement → Activation → Usage → Advocacy.
Now let’s say the primary area the team wanted to impact was awareness, because they weren’t certain new users knew this feature existed.
First, they would determine the desired customer behaviour they wanted to see, what is it they want new users to do.
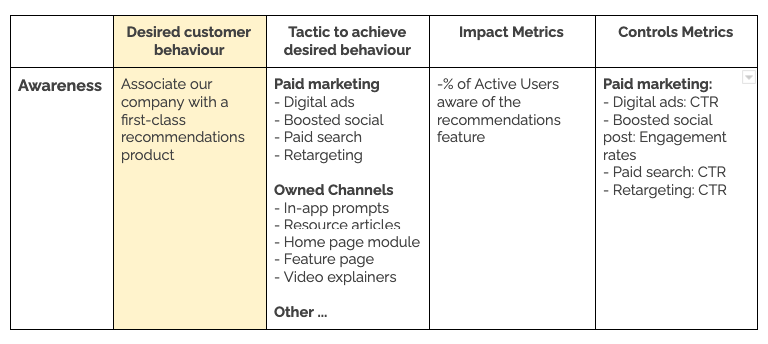
They planned the necessary tactics to achieve that desired customer behaviour. For example, at the Awareness stage, the tactics are mostly marketing focused and find ways to highlight the feature within the product.

The team would then outline their Impact Metrics. For example, the percentage of users who are aware of the Recommendations feature. You could also include other Impact Metrics that would show if you were achieving the goal.
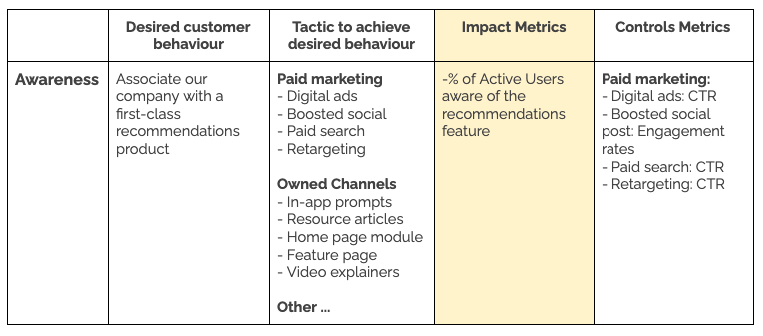
And finally, the Control Metrics – how they would actually measure the success of the Impact Metrics, for example, through digital ad Click Through Rates (CTR) or social post engagement rates.

In the same way, the team was able to draft the framework for the remaining stages of the life cycle:
- Consideration: here they might look at what new users do, for example, on the Recommendations feature page: how many articles they read, how many videos they watch, etc.
- Engagement: at this stage, the team is looking for the point at which the customer starts to use the product correctly
- Activation: once they have started using the feature, the team can look at how far they get
- Usage: next, they look at the behaviours and metrics around the usage of the feature
- Advocacy: at this final stage the user is now using the product but are they a believer? Do they continue to use it? Have they bought into it? Here the team's metrics include things such as if the user downloads reports or shares results with others
Results
With our playbook and framework, our aim is to enable people to conduct sound measurement in a way that's productive for teams and leadership, without needing a significant amount of resources. That measurement autonomy remains our long-term objective, but we're not quite there yet. Drafting and implementing the playbook has been phase one, and I'm really happy with what we achieved in the very short time we had.
Previously, our teams were always looking at the one big North Star metric such as the total number of users or revenue. Now, they're looking across the whole product lifecycle for different users, determining how to measure the different stages of the lifecycle, and are able to focus on one specific piece of the funnel at any one time. All of this has created alignment and accountability cross functionally, which is something we didn't have before.
We wanted to identify dependencies more clearly for product teams, where they're dependent upon other teams to help drive the end result. A good example of this result is how our product and marketing teams are now working together. They now know which levers they need to pull, which gears to turn, and how those actions will impact which results. Our product leadership is also better able to hold people and teams more accountable versus relying on them to hold themselves accountable.
In addition, it's given our teams the opportunity to better identify what's important in terms of data which has enabled us to give better direction to our engineering teams. We can provide more clarity around what we need to collect more of and the changes we need to make to our data infrastructure to better enable reporting.
Phase two will be driving the evolution of the framework to a point where people can simply reference it, fold it into how they think when creating products and product features and to where it becomes seamlessly integrated. They'll be able to easily understand the metrics they need and create the right connections to do it.
Conclusion
The components that make up this framework aren't revolutionary, but what's been getting people excited about it is how the framework is deployed. It's easier to comprehend versus other measurement methodologies being used already, which means implementing it at Mailchimp has been plain sailing.
What we learned from this process, something that was strongly reinforced by a retro we ran afterwards, was that we didn't have enough time. We were trying to stand something up so quickly, and when we started to present the framework in the workshops, it became clear that we didn't have enough robust information about what it was we were trying to do or how to make the framework successful.
If we could do it all over again, ideally we'd have had double the time to:
- Work with other teams to better understand the interdependency across groups
- Do more to properly understand our customers’ journey (in every user segment), not just simplified measures of success such as the percentage of customers who use our product
- Have a solid understanding of our tactics and a clear roadmap of what we were trying to do
Right now, we're just now getting to the point where we have built our first dashboards that are reporting on the metrics that came out of the framework process, and we're looking ahead to phase two. The next step is going to be connecting with our cross functional partners in design and marketing to expand the framework to be more robust. In addition we'll also be providing a clearer guide for when to engage each group and how to more effectively prepare to leverage the framework as a whole.